
Figure 7.
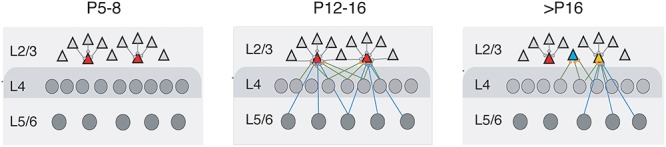
Summary of circuit changes in A1 over development. Graphic summary of L2/3 circuit development based on the functional excitatory connections. Color in L2/3 marks different cell types based on functional connections. Green: cells with local connections; orange: cells with major connections from L2/3 and L4 and few from L5/6; and grey: cells with major connections from L2/3, L4, and L5/6. We use similar colors for L4 and L5/6 cells because potential diversity is unknown. For the P5–8 group, most cells have very local connections inside L2/3. During early development (P9–11 and P12–16), most cells in L2/3 receive long-distance inputs from L4 and L5/6. Compared to P9–11, cells at P12–16 receive more inputs from L5/6. After P16, the connection pattern for L2/3 cells become more diverse.