
Figure 7.
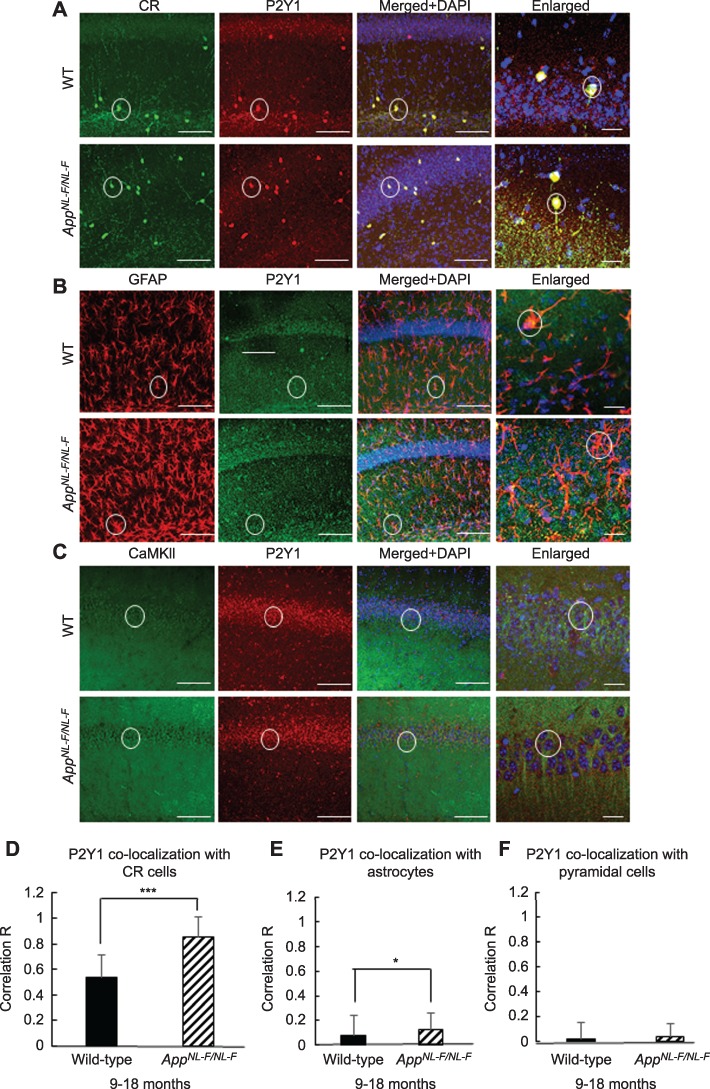
P2Y1Rs are predominantly expressed on CR cells and are upregulated in the AppNL-F/NL-F AD mouse model. (A–C) Confocal microscope, Z-stack images of P2Y1R colocalization on CR cells (green, Alexa 488), astrocytes stained for GFAP (red, Texas Red), and pyramidal cells stained for CaMKII-α (green, FITC), respectively in 9–18-month-old wild-type and AppNL-F/NL-F mice (taken at ×63 magnification, scale bar, 20 μm). Representative cells are outlined with white circles, and colocalization between the two channels appears yellow/orange. The merged images include the nuclear staining, DAPI (blue). (D–F) Graphs illustrate quantification of P2Y1Rs colocalized on CR cells, GFAP, and CaMKII-α in wild-type and AppNL-F/NL-F mice obtained from Z-stack images at ×20 magnification. The CR cells and astrocytes show a high level of coexpression with P2Y1Rs; however, the CR cells showed the highest level of P2Y1R coexpression, which seems to be upregulated in the AD model. Error bars represent the standard deviation from the mean. Two-tailed unpaired Student’s t-test was performed individually for panels (D–F) to compare wild-type and AppNL-F/NL-F mice within their respective groups. To measure across the three cell groups studied, a one-way ANOVA was performed with pairwise comparisons corrected for multiple comparisons (α = 0.05), with a post hoc Tukey’s test for multiple comparisons. *P < 0.05, **P < 0.01, ***P < 0.001 (40–240 cells, n = 4 animals for CR cells and n = 6 animals for GFAP and CaMKII-α).