
Figure 8.
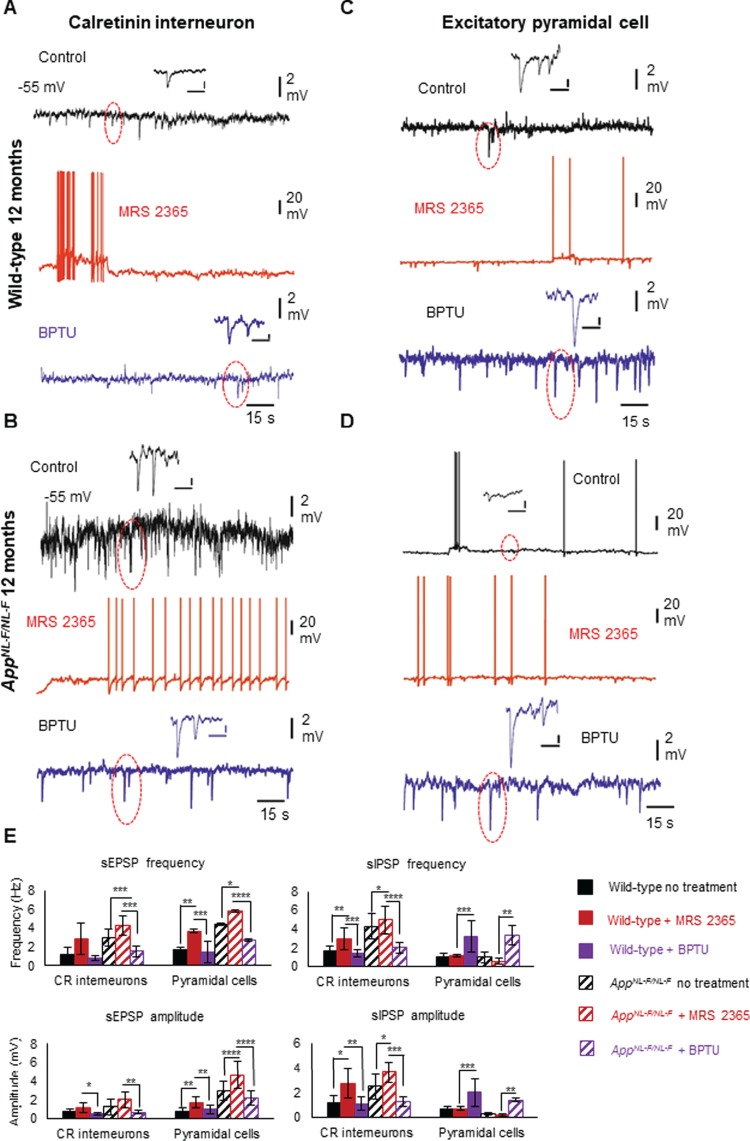
Enhanced inhibition among CR interneuron networks in AD is modulated by upregulated P2Y1Rs. (A–D) Whole-cell current-clamp recordings illustrating sIPSPs and sEPSPs in CR cells (A, B) and pyramidal cells (C, D) in CA1 of 12-month-old wild-type and AppNL-F/NL-F mice, recorded at a membrane potential of −55 mV in control conditions and after bath application of the P2Y1R modulators. Bath application of the P2Y1R-selective agonist, MRS2365 (500 nM), resulted in membrane excitation in both cell types, increasing the aberrant hyperexcitability. However, subsequent addition of the P2Y1R inhibitor BPTU (500 nM) differentially affected the cell types; the sIPSPs (examples are highlighted in circles) were dampened in CR cells, but increased in pyramidal cells, thus normalizing the homeostatic levels of inhibition in CA1. Similar results were obtained from wild-type mice shown in bar graphs. (E) Bar graphs show the overall pharmacological data obtained from wild-type and AppNL-F/NL-F mice at 9–18 months. A two-way ANOVA was performed with pairwise comparisons corrected for multiple comparisons (α = 0.05), with a post hoc Tukey’s test for multiple comparisons. *P < 0.05, **P < 0.01, ***P < 0.001, ****P < 0.0001. (see Table 3 for details).