Figure 1.

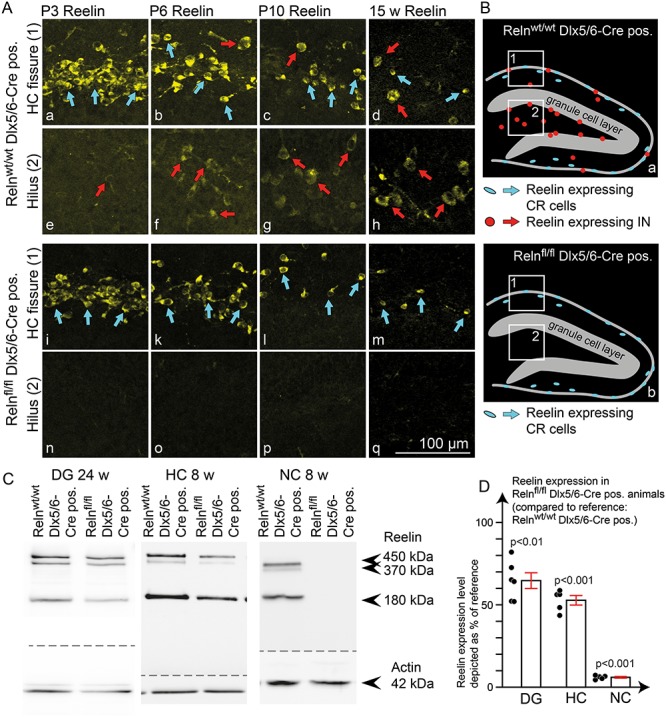
Reelin expression pattern in IN-specific Reelin knockout mice. (A) Immunohistochemical staining for Reelin at different developmental stages (age: P3, P6, P10, and 15 weeks) in IN-specific Reelin knockout mice (Relnfl/fl Dlx5/6-Cre positive) compared with controls (Relnwt/wt Dlx5/6-Cre positive). Stainings confirmed normal Reelin expression in CR cells (detail from the hippocampal fissure in control (a-d) and IN-specific Reelin knockout animals (i-m)) and a complete lack of Reelin expression in INs (detail from the hilus in control (e-h) and IN-specific knockout animals (n–q)). (B) Schematic drawing of Reelin-expressing cells in the dentate gyrus in control (a) and IN-specific knockout animals (b). (C) WB analysis from adult mouse brains (age: 24 weeks for DG; age: 8 weeks for NC and HC) revealed a profound reduction of Reelin expression in the dentate gyrus and total HC and a near-complete loss of Reelin in the NC. (D) WB quantifications showed a Reelin reduction of 94 ± 0.5% in the NC, 47 ± 3% in the HC (one-sample t-test against 100% control; N = 5 animals; age: 8 weeks), and 35 ± 5% in the dentate gyrus (one-sample t-test against 100% control; N = 6 DG samples (equally sampled from three animals); age: 24 weeks). All values were normalized to actin and depicted as a percentage of reference (Relnwt/wt Dlx5/6-Cre pos.). The results were depicted as mean ± SEM. Dots represent single values for each animal for NC and HC. In the case of the DG, dots represent measurements for left and right DG from three animals per genotype.
