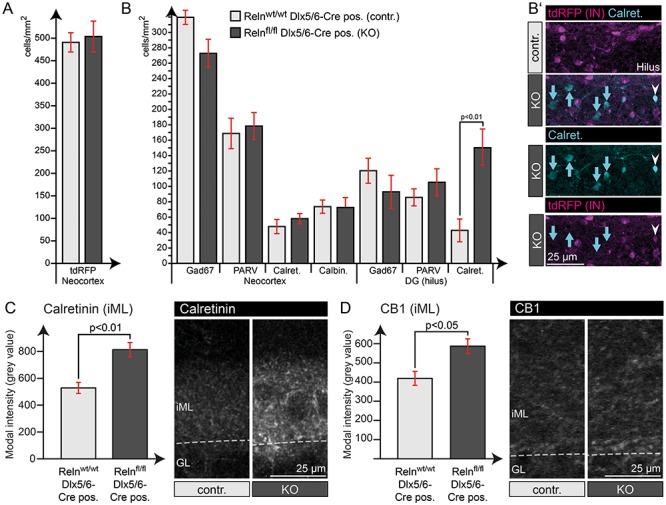
Figure 3.

Quantification of IN markers revealed higher Calretinin expression in the hilus. (A) Quantification of tdRFP-positive INs in the NC showed normal total IN numbers in IN-specific Reelin knockout mice. (B) Quantification of cells expressing different IN marker proteins throughout the NC and dentate gyrus revealed an unaltered IN composition within these areas. The significant increase in Calretinin-expressing cells in the dentate gyrus could be assigned to an increase in Calretinin expression in tdRFP-negative hilar mossy cells (B’ – blue arrows), while tdRFP-positive INs were not affected (white arrowheads). (C) Quantification of Calretinin intensity in the iML, the area of the mossy cell projections, confirmed this significant increase in Calretinin expression. (D) In addition, quantification of CB1 intensity within the iML also revealed a slight increase in expression (t-test; N = 5 animals; age: 24–30 weeks; error: ±SEM).
