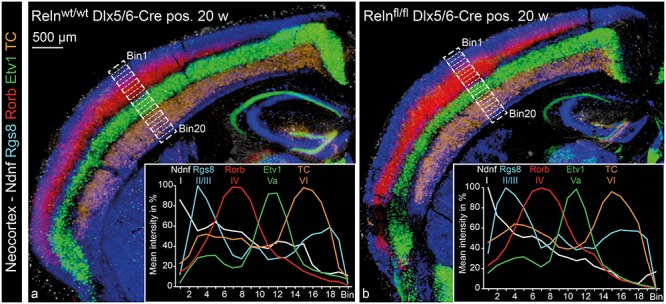
Figure 5.

Neocortical layering in IN-specific Reelin knockout mice. ISH for five different probes labeling specific layers of the NC was performed on consecutive cryo-sections from controls (a) and IN-specific Reelin knockout mice (b). Probes used were Ndnf for layer I, Rgs8 for layer II/III, Rorb for layer IV, Etv1 for layer Va and TC for layer VI. The consecutive sections are represented as a merger of five individually colored micrographs. Each of the five micrographs is a MIP of four optical planes (z-distance 4 μm). For quantification, the depth of the NC had been equally subdivided into 20 bins (starting with bin 1 at the pial surface and ending with bin 20 at the ventricular zone). Mean staining intensity was evaluated for each bin and depicted as a percentage ranging from maximum staining intensity (100%) to minimum staining intensity (0%) for each analyzed image. Diagrams show mean values for six analyzed images, equally sampled from three animals for both genotypes (Supplementary Fig. 4 includes the individual data sets).
