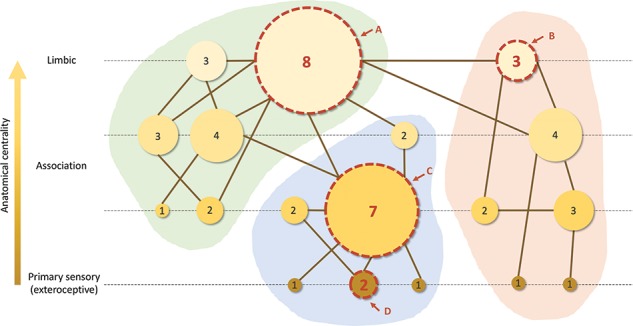
Figure 5.

Schematic illustration of distinct contributions of degree (represented by node size; larger nodes have more connections; number inside the node indicates the exact number of connections) and anatomical centrality (represented by node color; lighter color indicates higher anatomical centrality) to topological centrality in a hypothetical graph. The graph is split into three modules (green, blue, and red background shading). Four specific nodes are highlighted with a dashed boundary to schematically reflect connectivity profiles resulting from the combination of both contributions (degree and anatomical centrality). Node A has high degree and high anatomical centrality, node B has low degree and high anatomical centrality, node C has high degree and low anatomical centrality, and node D has low degree and low anatomical centrality. In general, nodes with more anatomical centrality and degree are more topologically central in the network.
