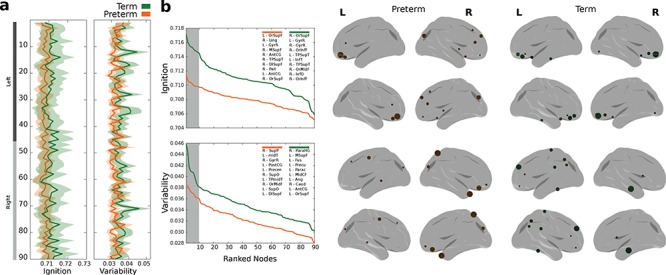
Figure 2.

Ignition. (a) Ignition values across the brain and variability across events for the preterm (orange) and the term (green) groups. Standard error is represented at a shaded area. (b) Ranked (descending) ignition and variability values where top 10 regions (highlighted in gray within the plot) for both groups are described at the top right insert. Rendered brains show the top 10 regions with the highest values in ignition and variability across events.
