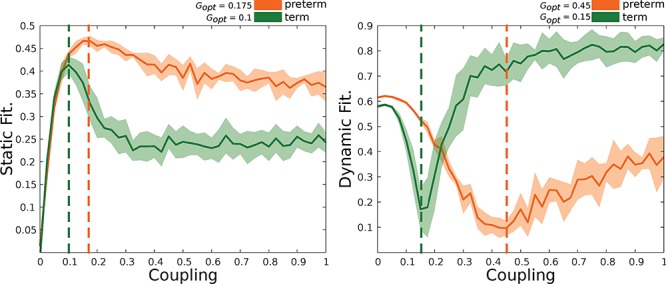
Figure 3.

Fitting between empirical and simulated brain activity. Static (left) stands for the correlation between empirical and simulated functional connectivity by means of a Pearson correlation coefficient. Dynamic (right) represents the Kolmogorov–Smirnov distance between the distributions of ongoing dynamics. The closer simulated and empirical dynamics are the lower the distance. The optimal coupling values are described in the top right corner of each plot. Preterm group (orange) and term group (green). Solid lines represent mean fitting values, while shadowed areas represent the standard deviation over simulations (as many as subjects per group).
