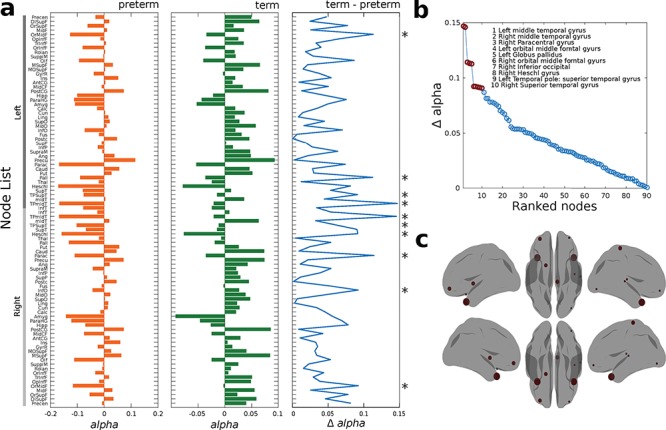
Figure 4.

Whole-brain Hopf bifurcation model. (a) Bar plot of alpha bifurcation values across the brain for preterm (orange) and term (green) groups. The third blue plot shows the absolute difference (term and preterm) between alpha bifurcation values on each region. Asterisks show the top 10 regions with highest difference. (b) Ranked absolute differences between the term and preterm alpha vectors. The top 10 regions presenting the highest difference are marked with red and described in the top right insert and (c) displayed in the rendered brains
