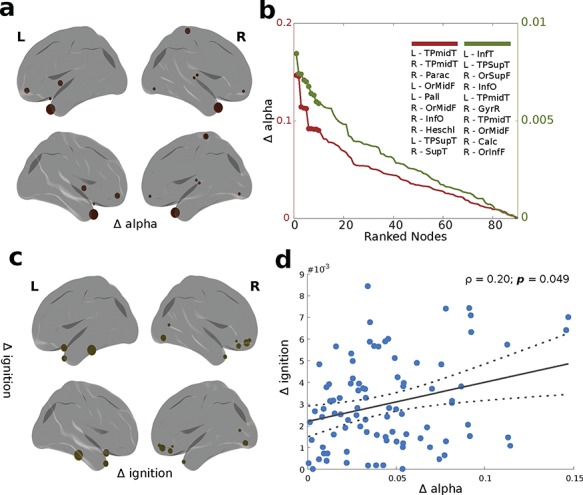
Figure 5.

Differences in bifurcation (alpha) and ignition values. (a) and (c) represent rendered brains showing the top 10 regions with the highest differences (delta) in alpha bifurcation and ignition values. (b) Plot representing the ranked delta in alpha (red) and ignition values (green), with the top 10 regions representing the highest differences described in the insert. (d) Scatter plot between delta alpha and delta ignition with a fitted linear regression (straight gray line) and 95% confidence bounds (dotted lines). Spearman’s rank correlation coefficient between these two variables is indicated by r.
