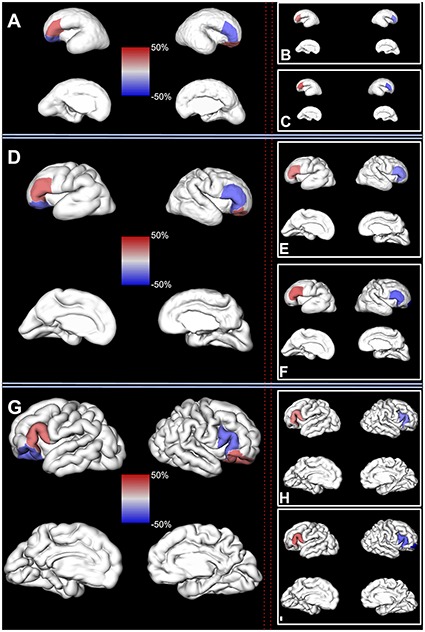
Figure 6.

Hemispheric asymmetry. Left column: significant regional asymmetries in the volume of the fetal cortex (composed of SP and CP) are shown on a reconstructed pial surface of 24.7 (A), 29.6 (D), and 35.29 (G) GW fetus. Positive regional asymmetry indicates leftward asymmetry (in red). Negative regional asymmetry indicates rightward asymmetry (in blue). The relative difference (%) in the regional volume between left and right hemisphere can be seen on the color-coded bar in the center. Right column: significant regional asymmetries in the volume of the fetal compartments are shown on a reconstructed pial surface of the brain from the first column. (B, E, and H) Regional asymmetries in the volume of the CP. (C, F, and I) Regional asymmetries in the volume of the SP. Color coding of relative differences (%) is the same as in the left column.
