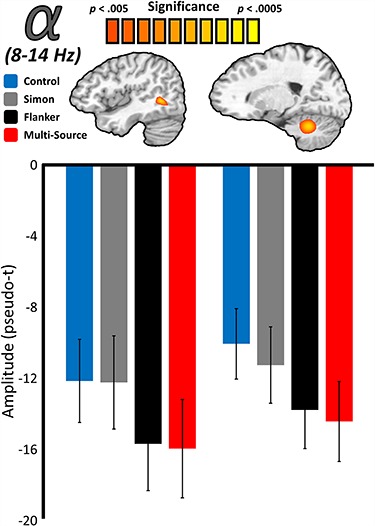
Figure 4.

Main effects of interference on the posterior alpha response. Source-level images (top) reflect the significant results of whole-brain RM–ANOVAs testing for a main effect of interference condition on visual neural responses in the alpha-frequency (8–14 Hz) band, with the color scale bar at the top denoting voxel-wise significance. Below each image are the average response amplitude values (in pseudo-t) for each interference condition, with error bars denoting standard error of the mean (SEM). For both the right lateral occipital and right cerebellar peak voxels, responses to Simon interference did not differ from the control condition, and responses to Flanker interference did not differ from multisource interference. Responses to Simon and Flanker interference also significantly differed at both locations.
