
Figure 3.
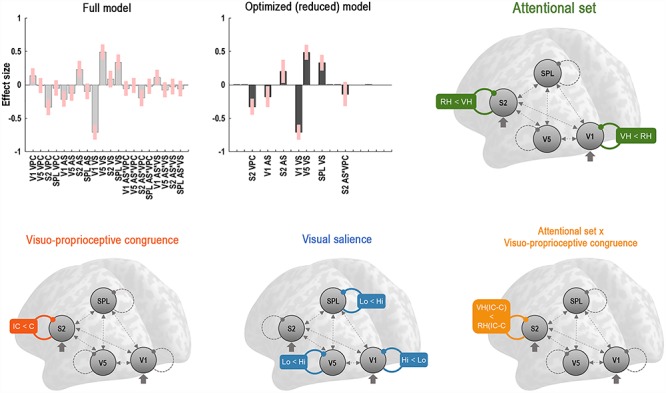
DCM results. Results of the BMR testing for all possible modulatory effects on regional self-connectivity. The plots show the parameter estimates with 90% posterior confidence intervals of the full model and the optimal reduced model (Bayesian model averages of retained parameters), indicating how strongly each coupling parameter was modulated by the respective main or interaction effect (AS = attentional set; VS = visual salience; VPC = visuoproprioceptive incongruence; see Supplementary Fig. 15 for details). The retained modulation effects are schematically depicted. Dashed lines indicate latent (endogenous) connectivity; thick arrows indicate driving inputs; colored lines indicate (nonredundant) modulation effects. The labels indicate the relative direction of each modulation effect; i.e., the difference in self-inhibition (VH/RH = virtual hand/real hand task; C/IC = congruent/incongruent visuo-proprioceptive mapping; Lo/Hi = low/high visibility). Note that a reduced self-inhibition implies disinhibition and increased sensitivity to inputs; i.e., an increase in gain (e.g., VH < RH indicates a stronger disinhibition during the VH than during the RH task). Most importantly, the optimized model was characterized by selective disinhibition of the V1 or S2 by the attentional set adopted in the VH task or RH task, respectively.