Fig. 1.
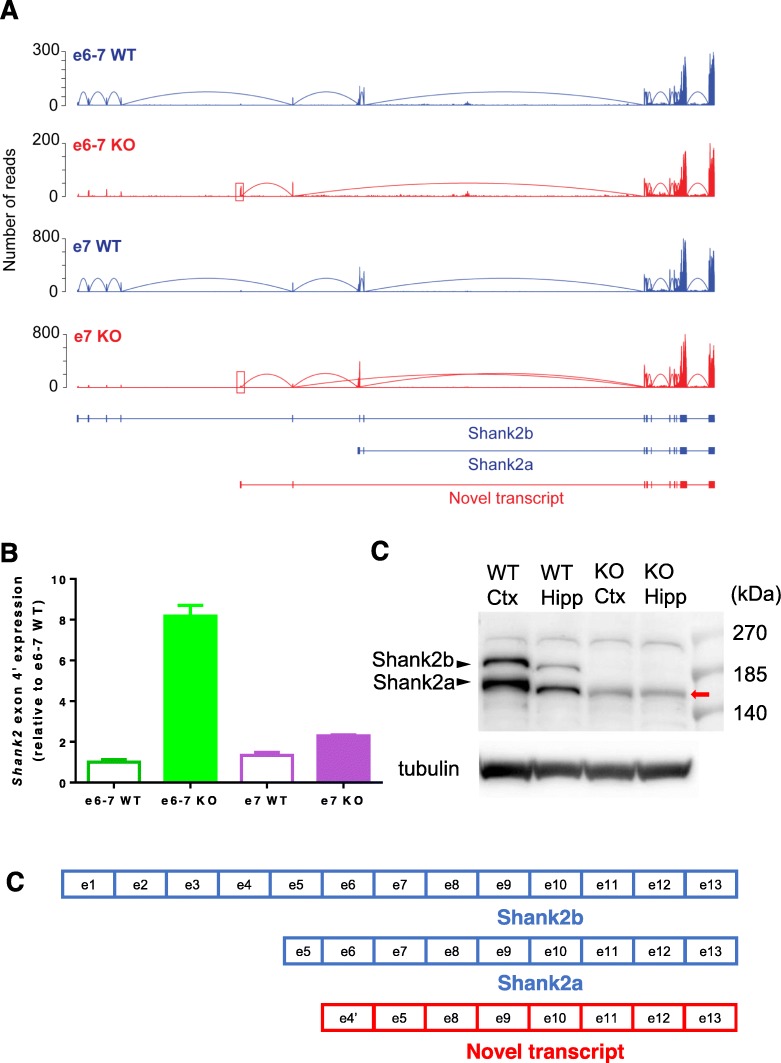
Identification of the novel exon 4′ in Shank2 KO mice and validation of mRNA and protein expression of this transcript. a Read distribution plots and transcript structures in e6–7 and e7 knockout (KO) and their own wild type (WT) littermate samples. RNA-Seq data (NCBI GEO GSE79824; GSM2104342 - GSM2104353) were processed as described in the method section. Blue color represents WT samples and red color represents KO samples. Red box shows the identified novel exon 4′ in KO samples. b Real time quantitative PCR using primers that span exon 4′ and 5. Five hippocampi per group were used for the analysis; experiments were carried out in triplicates. c A schematic exonic diagram of translated proteins from the different Shank2 transcripts. d Western blot analysis of the Shank2 proteins. The long (Shank2b) and short (Shank2a) Shank2 isoforms were detected in WT, which were completely missing in e6–7 KO. In e6–7 KO, a clear band for the novel isoform (red arrow) was detected slightly below the band for Shank2a. The difference between the two bands are emphasized in a different electrophoresis condition (Fig. S1)

