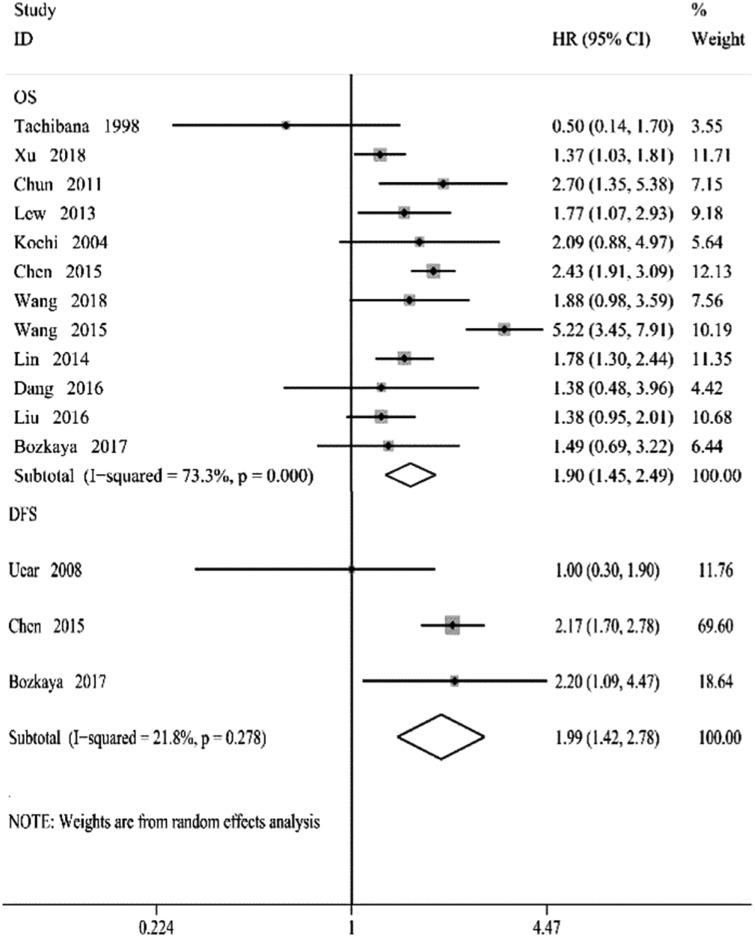
Figure 2.
Forest plots of studies evaluating the association between pre-treatment serum AFP levels and gastric cancer. The squares and horizontal lines correspond to the study specific hazard ratios (HR) and 95% confidence intervals (CIs), respectively. The area of the squares reflects the weight (inverse of the variance). The diamond represents the summary HR and 95% CI.

