
Figure 2.
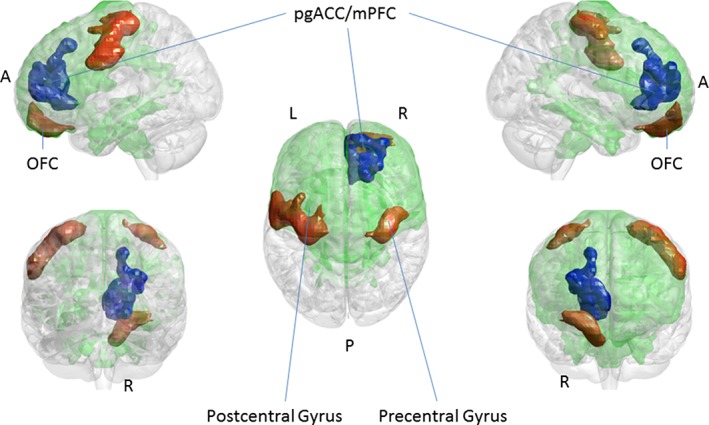
Brain imaging results sagittal, coronal, and axial views of glass brains, where the green depicts the frontolimbic mask. The four significant interaction clusters are depicted in red (right orbitofrontal cortex [OFC], left postcentral gyrus, and right precentral gyrus), or blue the pregenual anterior cingulate cortex (pgACC) and medioprefrontal cortex (mPFC). Follow‐up t tests revealed that being criticized perfusion significantly decreased in the right pgACC/mPFC (in blue), but only after active tDCS [Color figure can be viewed at http://wileyonlinelibrary.com]