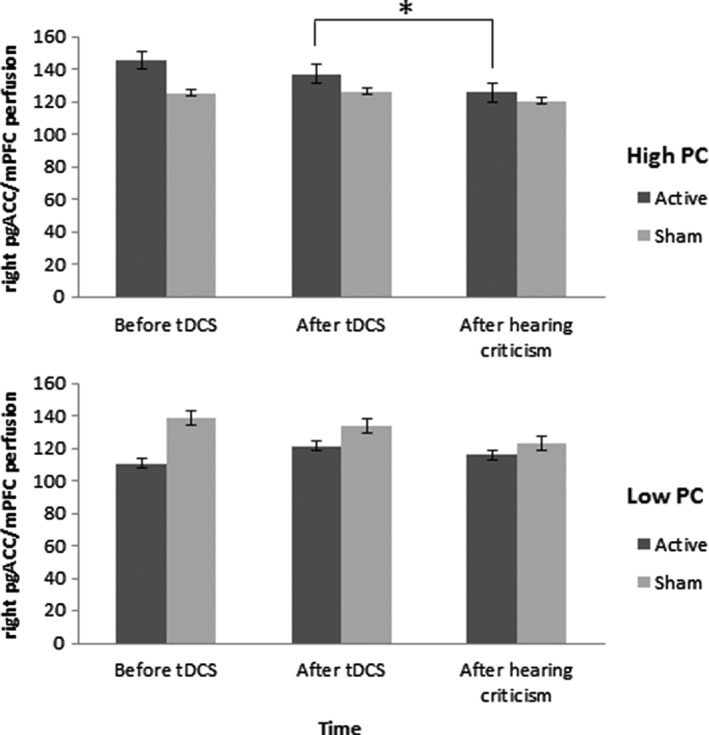
Figure 3.

Bar graphs of the right pgACC/mPFC cluster perfusion patterns (means and SE) for the groups respectively scoring high and low on perceived criticism (PC) before (ASL T1) and after (ASL T2) tDCS and after hearing criticism (ASL T3), and this for the active and sham tDCS condition. *significance set at p < .05, two‐tailed
