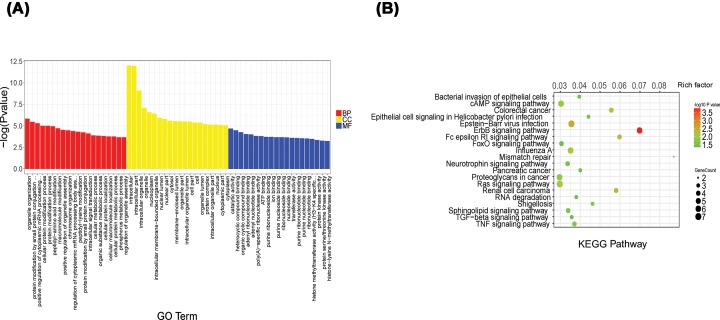
Figure 2. GO analysis and KEGG pathway annotation of differentially expressed circRNAs.
(A) The top 20 significantly obvious changes in GO biological process classification. Red, yellow and blue bars respectively represent biological process, cellular component, and molecular function, respectively. (B) The top 20 significant obvious changes in KEGG pathway classification. The bar plot shows the top Enrichment Score (−log10 (P value)) value of the significant pathway. The color represents the difference, darker indicating a greater difference. The circle represents the relationship between the gene and the pathway, the larger circles represent a stronger relationship between the gene and the pathway.

