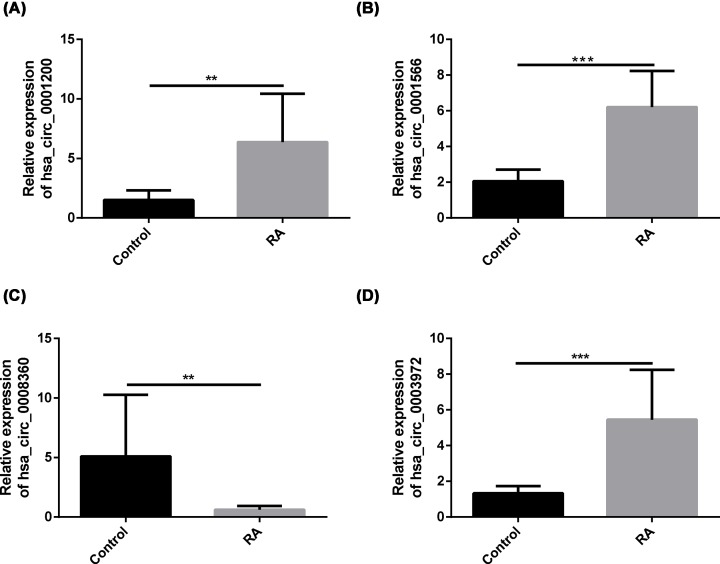
Figure 5. Quantitative RT-qPCR determined the relative expression levels of circRNAs in PBMCs from 10 RA patients and 10 healthy controls.
Hsa_circ_0001200 (P<0.01), hsa_circ_0001566 (P<0.01), hsa_circ_0003972 (P<0.01) exhibited the same increasing trend as the sequencing results (A,B,D). Hsa_circ_0008360 (P<0.01) exhibited the same decreasing trend as the sequencing results (C). A p-value < 0.05 was statistically significant (*P<0.05, **P<0.01, ***P<0.001).

