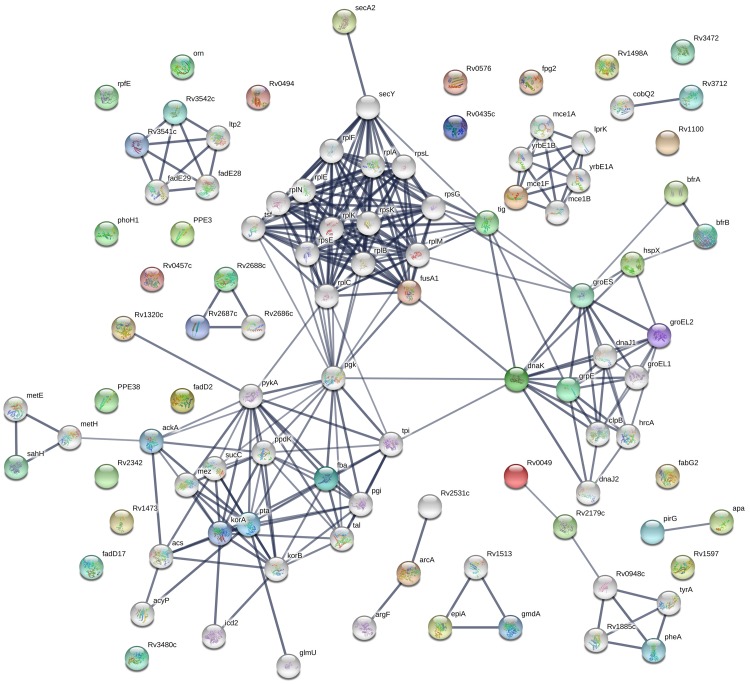
Figure 1.
STRING analysis of 58 candidate biomarkers identified by serological screening of proteome microarrays containing 4,262 TB proteins. Interaction networks with confidence levels of 0.7 were visualized with edges representing protein-protein associations. Empty nodes, proteins of unknown 3D structure; filled nodes, some 3D structures known or predicted; colored nodes, query proteins and first shell of interactions; white nodes, second shell of interactions; and thicker lines, stronger protein–protein associations.

