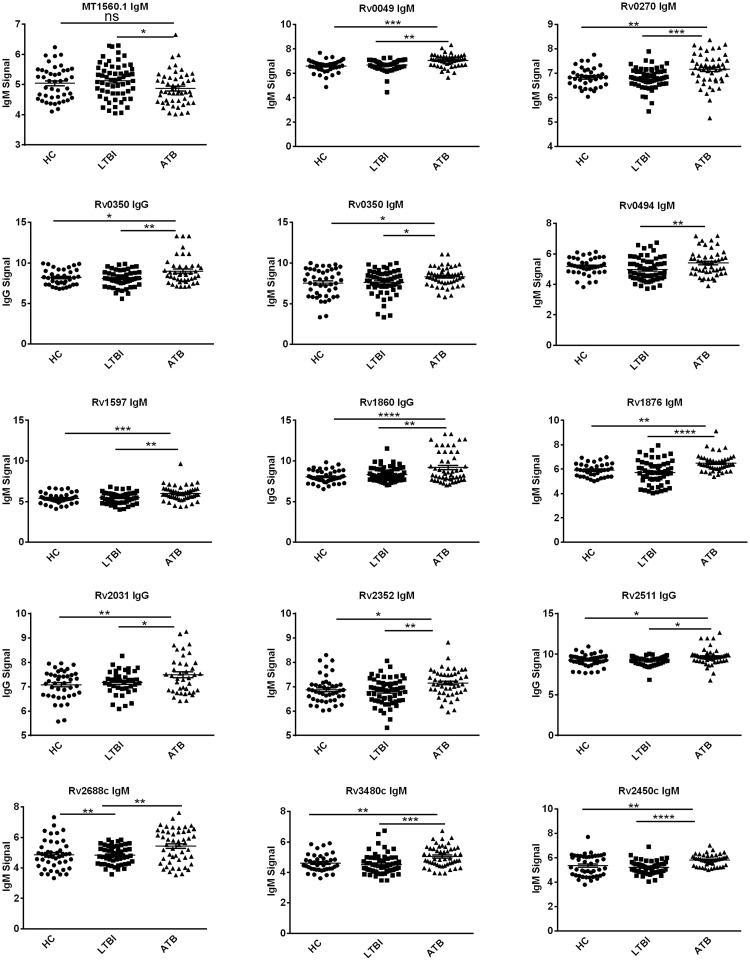
Figure 2.
Scatter plots of 15 IgG and IgM signals for reactivity against 14 TB proteins in ATB patients, individuals with LTBI and HCs. Each point represents one serum sample and horizontal solid lines indicate the mean signal for each group of serum samples. *P < 0.05; **P < 0.01; ***P < 0.001; ATB, active TB; Control, healthy control; IgG, immunoglobulin G; IgM, immunoglobulin M; LTBI: latent TB infection; ns, not significant; and TB, tuberculosis.

