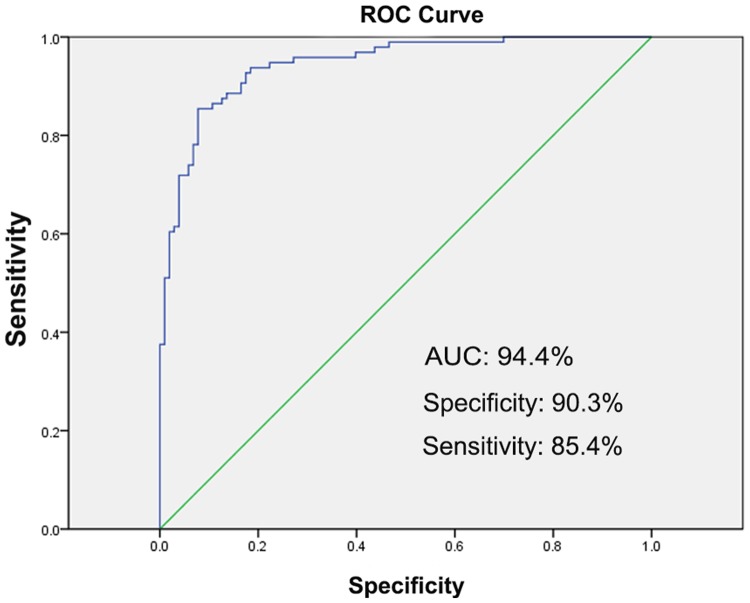
Figure 4.
ROC curve of the combination of 15 TB antigens as biomarkers for distinguishing individuals with LTBI and ATB. The blue line represents the logistic regression model including the 15 TB antigens, and the green line represents the reference. AUC, area under the ROC curve; ROC, receiver operating characteristic.

