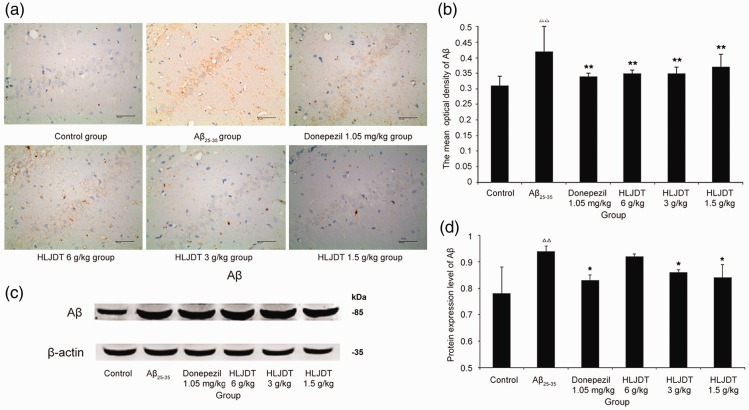
Figure 3.
Beta-amyloid (Aβ) expression in rat hippocampal tissue. (a) Light micrographs (400×) of the rat hippocampal CA1 region stained for Aβ using immunohistochemistry techniques. (b) Quantification of the data for Aβ expression obtained using immunohistochemistry techniques. (c) Representative western blots showing Aβ protein expression levels in the rat hippocampus. (d) Quantification of Aβ expression data that were obtained using western blot techniques. HLDJT, Huang-Lian-Jie-Du-Tang; △△P < 0.01, △P < 0.05 vs. the control group; *P < 0.05, **P < 0.01 vs. the Aβ25–35 group (n = 8/group).

