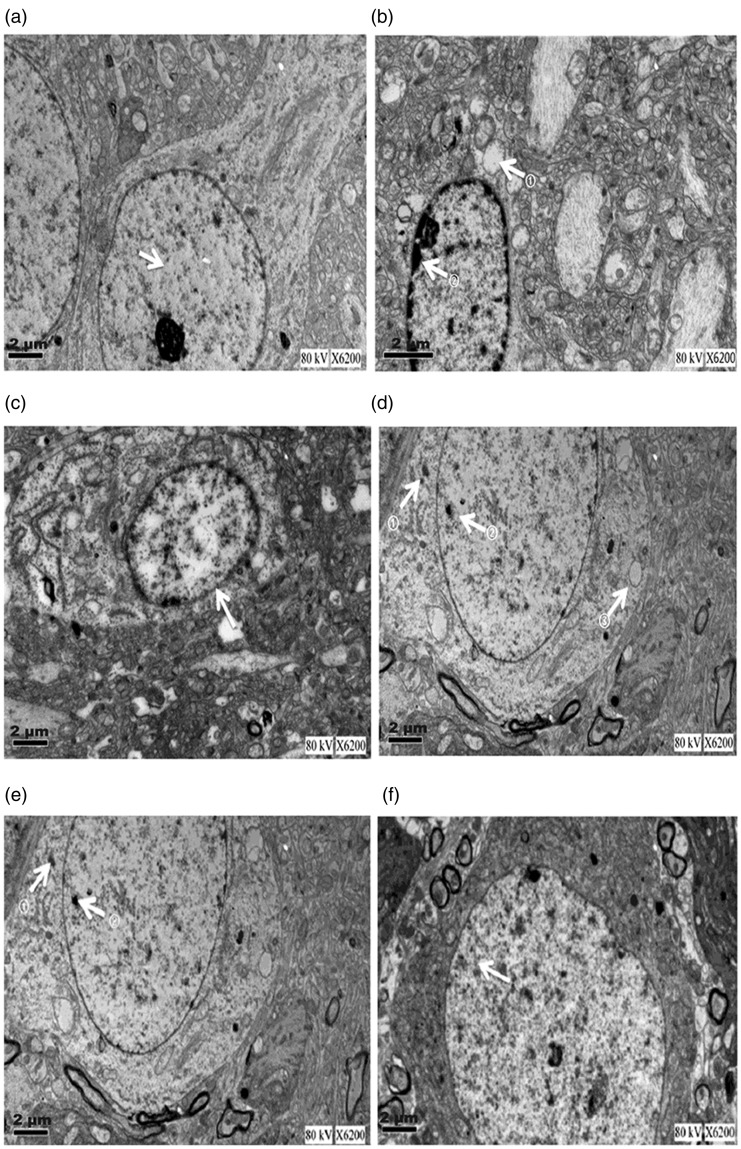
Figure 7.
Ultrastructural changes in the rat hippocampal CA1 region. Electron microscopy was used to assess the ultrastructural changes (1250×). (a) Control group. Arrow: chromatin homogeneity in the hippocampal cell. (b) Aβ25-35 group. Upper arrow: vacuolar region in the cytoplasm; lower arrow: chromatin agglutination on the nuclear membrane. (c) Donepezil hydrochloride group. Arrow: relatively complete nuclear membrane (although its integrity was not as high as that of the control group). (d) HLJDT 6 g/kg group. Arrows: small amounts of lipofuscin. (e) HLJDT 3 g/kg group. Arrows: small amounts of lipofuscin. (f) HLJDT 1.5 g/kg group. Arrow: small amount of lipofuscin. HLDJT, Huang-Lian-Jie-Du-Tang.

