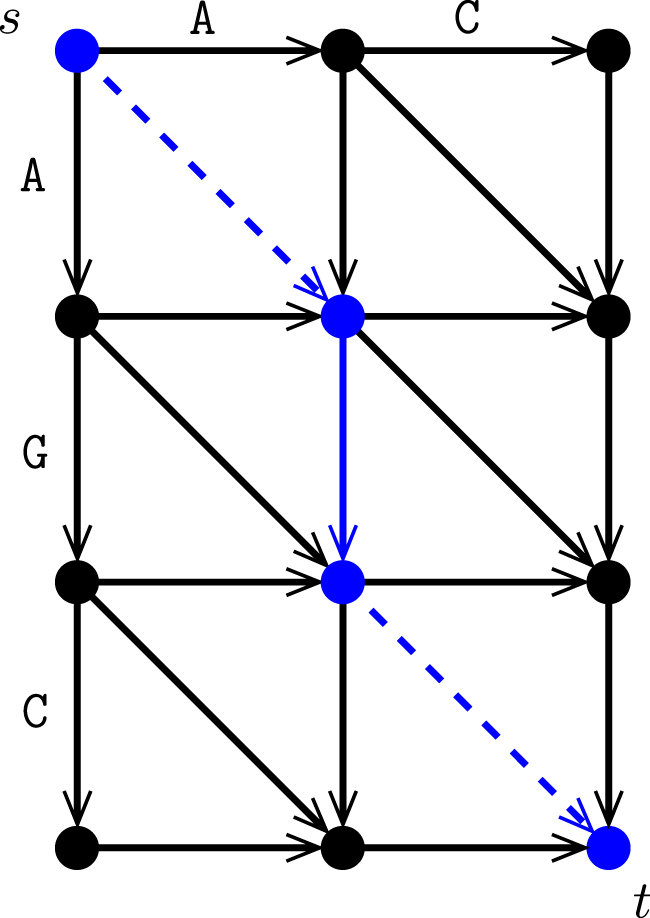
FIG. 2.

Conventional alignment graph. The alignment graph for AC versus AGC. Those edges that correspond to matches are in dashed lines (cost of a match is often 0). Solid lines show substitutions and indels, which usually have a positive cost. The edit distance is the shortest distance from s to t in this graph (shown in blue).
