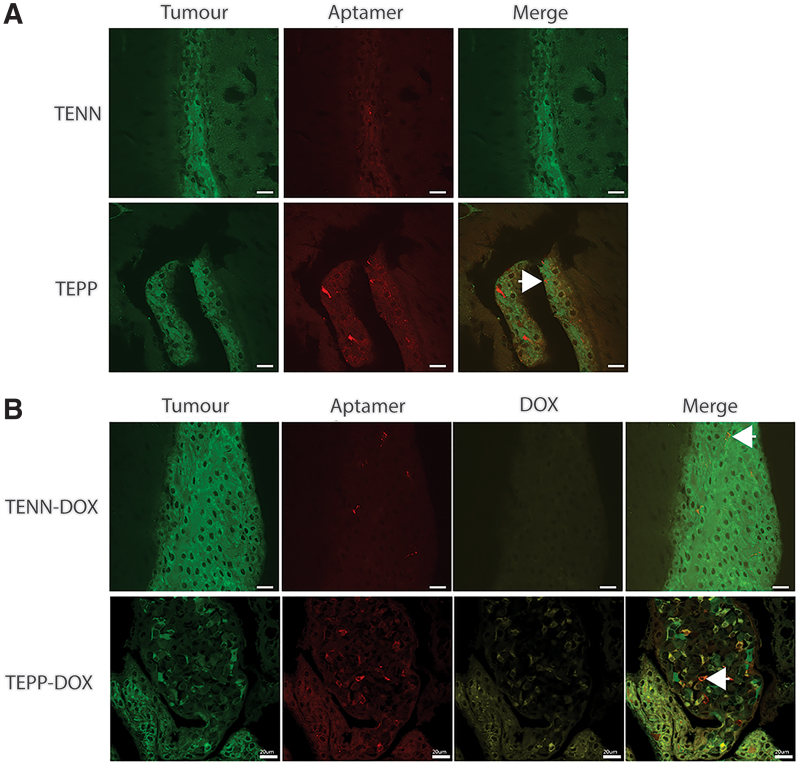
FIG. 8.
Brain distribution of aptamer or aptamer-DOX conjugates following tail vein injection. Brains were excised 60 and 75 min postintravenous administration, postfixed in 4% PFA, cryoprotected in 20% sucrose at 4°C overnight, sectioned, and imaged using laser scanning confocal microscopy. Representative images of three mice/group. Green: GFP tumor; red: TYE665-labeled bifunctional aptamer; and yellow: DOX. Arrow indicates areas of colocalization of aptamer and tumor cell (A) or aptamer-DOX and tumor cell (B). Scale bar: 20 μM. Color images are available online.

