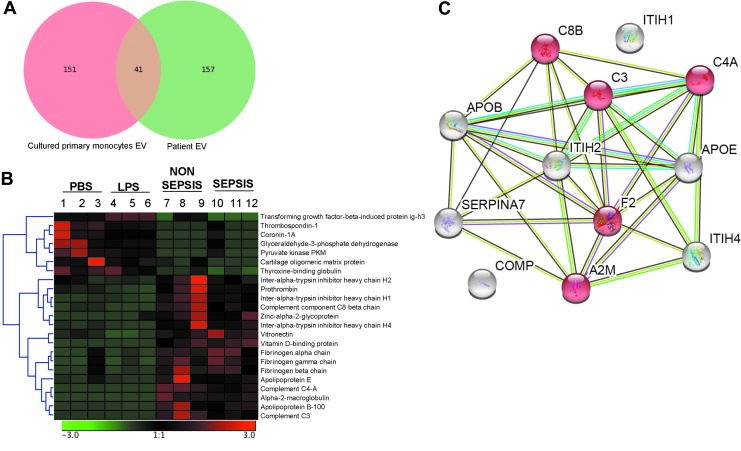
FIG. 4.
Protein expression. (A) Vein diagram illustrating proteins detected in exosomes obtained from cultured primary monocytes exposed to lipopolysaccharide or phosphate-buffered saline (red) and septic patients compared with critically ill subjects (green). Protein expression data were obtained using liquid chromatography–nanospray tandem mass spectrometry. A total of 41 proteins were detected in both analyses. (B) Hierarchical clustering analysis of significant proteins (one-way analysis of variance; p < 0.05) detected both in the exosomes obtained from cultured primary monocytes exposed to lipopolysaccharide (LPS) or phosphate-buffered saline (left) and septic patients compared with critically ill subjects (right). (C) STRING version 10.5 was used to construct protein–protein interaction network of common, significantly down-regulated proteins in exosomes obtained from septic patients compared with cultured primary monocytes exposed to LPS. Line or strings indicate protein interactions.

