Abstract
We describe a new method of fluorescence sensing based on fluorescence polarization. The sensor consists of two compartments, both of which contain the sensing fluorophore. One side of the sensor contains a constant concentration of analyte, and the other contains the unknown concentration. Emission from both sides is observed through polarizers, with the polarization from the sample being rotated 90° from that of the reference. Changes in the fluorescence intensity of the sample result in changes in the measured polarization for the combined emission. We show that this approach can be used to measure glucose and calcium using fluorophores which show analyte-dependent intensity changes, and no change in the spectral shape. Only a single fluorophore is required, this being the sensing fluorophore in both sides of the sensor. We also show that polarization sensing of glucose and calcium can be performed with visual detection of the polarization. In this case the only electronic component is the light source. These simple schemes can be used with a variety of analytes. The only requirement is a change in fluorescence intensity in response to the analyte.
Index Headings: Fluorescence sensing, Glucose, Calcium, Protein sensors, Polarization, Anistropy
INTRODUCTION
During the past decade there have been continued advances in the methodology for fluorescence sensing.1–5 Numerous new sensing fluorophores have been developed that provide responses to specific analytes, especially to cations and anions.6–10 A significant problem in fluorescence sensing is the difficulty of performing intensity measurements in a real-world situation. Intensity measurements are typically unreliable or require frequent re-calibration because of a variety of chemical and instrumental factors. Hence, there has been a considerable effort to develop sensing fluorophores that display spectral shifts in response to analyte binding, the so-called wavelength-ratiometric probes. Such probes are available for Ca2+,11–13 Mg2+,14,15 and pH.16 However, it has not been possible to develop wavelength-ratiometric probes for all analytes, particularly analytes such as chloride17,18 and oxygen,19–23 which act as collisional quenchers.
Methods have been developed to avoid the dependence on intensity measurements. One approach is to use the fluorescence lifetime instead of the intensity, which is called lifetime-based sensing.24,25 In this case, one selects a fluorophore that displays a change in lifetime in response to the analyte. Lifetime-based sensing has been reported for a wide range of analytes, including collisional quenchers.26,27
Another method to avoid the need for absolute intensity measurements is to use fluorescent internal standards. In this case the sensor contains two fluorophores, one of which responds to changes in the analyte concentration. This approach has been used with phase-modulation fluorometry to develop sensors for pH and pCO2,28,29 glucose,30 and calcium.31 These approaches require the use of an amplitude-modulated light source, which is available from simple light-emitting diode light sources.32–35
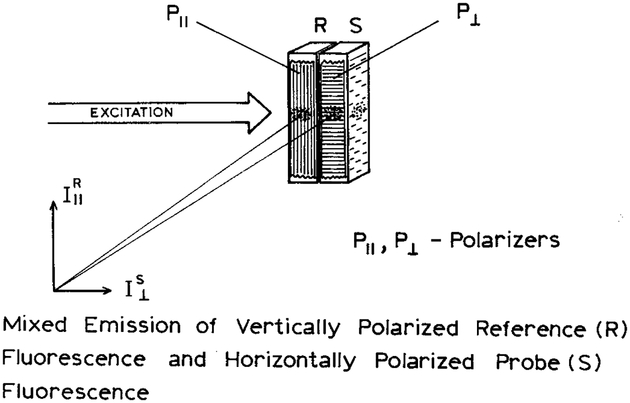
We now describe a new method of internal referencing that can be accomplished with only steady-state measurements and can be used whenever the fluorescence intensity changes in response to the analyte. This self-reference method is shown in Scheme I. The sensor consists of two parts. One side contains the sensing fluorophore and a constant concentration of analyte, and is regarded as the reference (R). The other side contains the unknown concentration of analyte, and is regarded as the sample (S). The emission from each side passes through a film polarizer prior to reaching the detector. The orientation of the sample polarizer (P⊥) is rotated 90° relative to the reference polarizer (P∥). The emission from both sides of the sensor is observed through an analyzer polarizer, which allows measurement of the parallel (I‖R) and perpendicular (I⊥S) components of the combined emission. The parallel (∥) orientation is taken as the laboratory vertical axis. The combined emission is then observed through an analyzer polarizer. Because of the emission polarizers on the sample, the parallel measurement reveals the intensity of the reference (I‖R), and the perpendicular measurement reveals the intensity of the sample (I⊥S). These values are used to calculate the polarization of the combined emission. Changes in the intensity from the sample (I⊥S) result in changes in the polarization values.
Scheme I.
Experimental configuration for polarization-based sensing.
The approach shown in Scheme I promises to be both simple and reliable. Only a single sensing fluorophore is needed, and it is used on both sides of the sensor. Furthermore, it seems likely that factors which affect the intensity of the sensing fluorophore will be similar for both sides of the sensor, which should result in good long-term stability of the calibration curve.
In the present report we describe the operating principles of the polarization sensor (Scheme I). We then show how this approach can be used to measure glucose and calcium, in both cases using probes which change intensity in response to the analyte but do not show spectral shifts. We also show how the sensor shown in Scheme I can be adapted for use with visual detection of the polarization.
THEORY
Polarization-Based Sensing.
The theory describing the polarization values from the combined sensor can be developed with a few simple considerations. The polarization of the combined emission from the sample and reference is given by
| (1) |
where the superscript T indicates the sum of the intensities from the sample and reference. The subscripts indicate the parallel (∥) and perpendicular (⊥) components of the emission as measured through the analyzer polarizer. Because of the polarizers in front of the reference and sample sides of the sensor, the polarized intensities are given by
| (2) |
| (3) |
where I‖R and I⊥S represent the intensities from the reference and sample, respectively. In the present cases, and in many situations, the emission from the sample and reference is unpolarized, so that the polarized intensities are proportional to the total intensity from each side of the sensor.
The intensities from the sample and reference depend on a number of instrumental factors, including the excitation intensity, the probe concentration, the filter transmission, the polarizer efficiency, the quantum yield, the observation wavelength, and the intensity of each light source. For simplicity, we chose not to explicitly indicate these factors.
Substituting Eqs. 2 and 3 into Eq. 1 yields
| (4) |
The measured polarization depends on the intensity of the sample relative to the reference. If the sample intensity is very low, then the polarization approaches I.0. If the emission from the sample dominates, then the polarization approaches −1.0. Hence a wide range of polarization values is available, resulting in a wide dynamic range for the sensor.
It is important to notice that polarization-based sensing can be accomplished without a change in the polarization of the sample. This counterintuitive result is obtained because the polarizers on the emission side of the sensor provide polarized light from sample and reference.
Polarization-Based Sensing with Visual Detection.
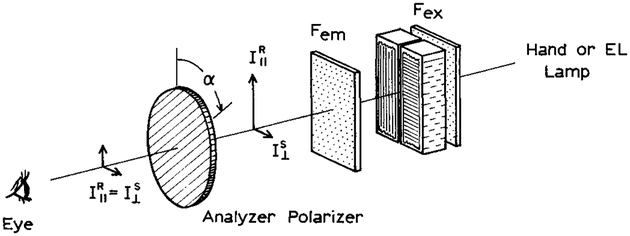
Polarization-based sensing can also be accomplished with visual detection using the apparatus in Scheme II. In this case the emission sides of the reference and sample are again covered with film polarizers in the vertical and horizontal orientations, respectively. The emission is observed visually through a long-pass filter and a second analyzer polarizer. The intensities on the vertical and horizontal sides of the image are given by
| (5) |
| (6) |
where α is the angular displacement of the analyzer from the vertical position. For visual measurements, the analyzer is rotated until the intensities from the reference and sample are perceived to be equal. For this condition one has
| (7) |
and
| (8) |
Changes in the intensity from the sample result in changes of the analyzer angle needed to equalize the intensities. We call this difference the compensation angle, Δα.
| (9) |
In this expression α0 refers to the angle needed to equalize the intensities in the absence of analyte, or some other chosen initial condition. The value of α0 will depend on the intensity of the reference relative to that from the sample with no analyte or at the initial condition.
Scheme II.
Polarization sensing with visual detection. The values of α is zero degrees when the analyzer polarizer is oriented vertically.
At first glance one is tempted to believe that the accuracy would be poor in visual determination of α. In fact, we found that an accuracy of one to two degrees can be routinely obtained.36 This excellent accuracy is due to the high sensitivity of the human eye in detecting small differences in relative intensity. To be more precise, we found that a 10% difference in intensity is detectable by most individuals, and a 10% difference is adequate to determine α to within one to two degrees.36
MATERIALS AND METHODS
Human serum albumin (HSA) and 8-anilino-1-naphthalenesulfonic acid (ANS) were obtained from Sigma, Inc. and used without further purification. The HSA concentration was 3.3 mg/mL. The ANS concentration was 1.2 × 10⁻⁵ M as calculated from ∈ (372 nm) = 7800 M−1 cm−1. The solution of HSA and ANS was in 0.05 M phosphate buffer, pH = 7.
The glucose assay was accomplished by using the glucose/galactose binding protein (GGBP) from E. coli. We used a mutant which contained a single cysteine residue at position 26.30 This protein was labeled with (4′-iodoacetamidoanilino)naphthalene-6-sulfonic acid (I-ANS) from Molecular Probes, Inc. A solution containing 2.5 mg/mL Q26C GGBP in 20 mM phosphate, 1 mM tris-(2-carboxyethyl)phosphine (TCEP), pH 7.0, was reacted with 50 μL of a 20 mM solution of I-ANS in tetrahydrofuran (purchased from Molecular Probes, Inc.). The resulting labeled protein was separated from the free dye by passing the solution through a Sephadex G-25 column. The protein-ANS conjugate was purified further on Sephadex G-100 and dissolved in 20 mM phosphate, pH 7.0.
Fluo-3 was obtained from Molecular Probes, Inc. The calcium concentration was controlled by using calcium buffer kits, C-3009, also from Molecular Probes, Inc.
RESULTS
Operating Principle of Self-Referenced Polarization Sensing.
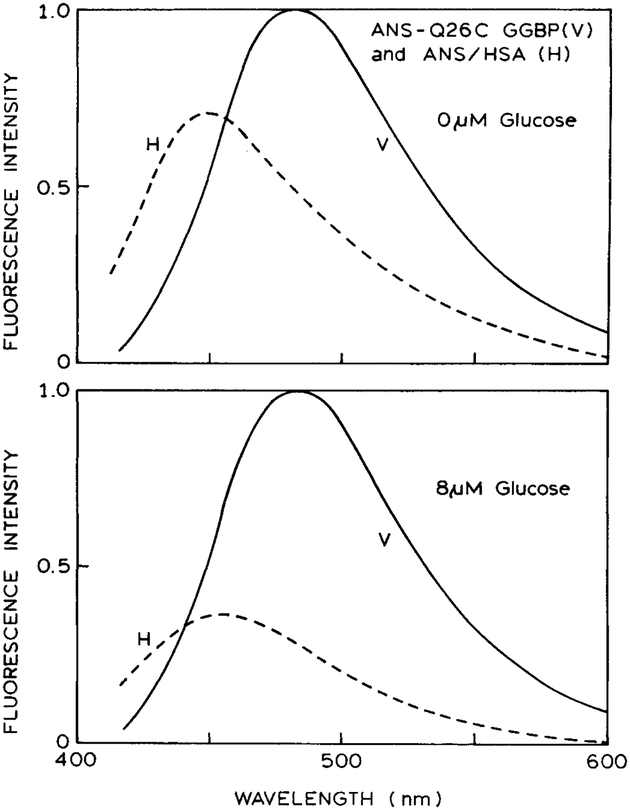
To illustrate the principles of polarization sensing, we chose to initially present our results using two different fiuorophores. One side (V) of the sensor contained a constant concentration of HSA with noncovalently bound ANS. The other side (H) of the sensor contained the glucose/galactose binding protein from E. coli. These samples displayed similar but slightly different emission spectra. The emission maxima for ANS/HSA and ANS-Q26C GGBP (cysteine26 mutant of GGBP labeled with I-ANS) were 485 and 450 nm, respectively.
The different emission maxima for the two sides of the sensor allow visualization for determining the contribution from each fiuorophore to the total emission. The emission spectra were recorded from the combined sensor (Fig. 1). When the emission polarizer was in the vertical orientation, the emission spectrum was characteristic of ANS/HSA. When the emission polarizer was in the horizontal position, the emission spectrum was characteristic of labeled GGBP. These results demonstrate that Eqs. 2 and 3 provide an accurate description of the polarized components of the emission. More specifically, the emission spectra observed through a vertically or horizontally oriented polarizer represent the emission from ANS/HSA and ANS-Q26C GGBP, respectively.
Fig. 1.
Emission spectra of the vertical (V) and horizontal (H) components from the combined sensor. The vertical polarizer is placed in front of the ANS/HSA solution. The horizontal polarizer is placed in front of the ANS-Q26C GGBP sample. The upper and lower panels show the component spectra in the absence and presence of 8 μM glucose, respectively.
GGBP labeled with I-ANS displays only a moderate change in intensity due to glucose. From other experiments we know that the glucose binding constant is near 1 μM.30 Addition of 8 μM glucose to labeled GGBP results in an approximately twofold decrease in the intensity of the ANS label (Fig. 1). We used this decrease as the basis of our polarization sensor.
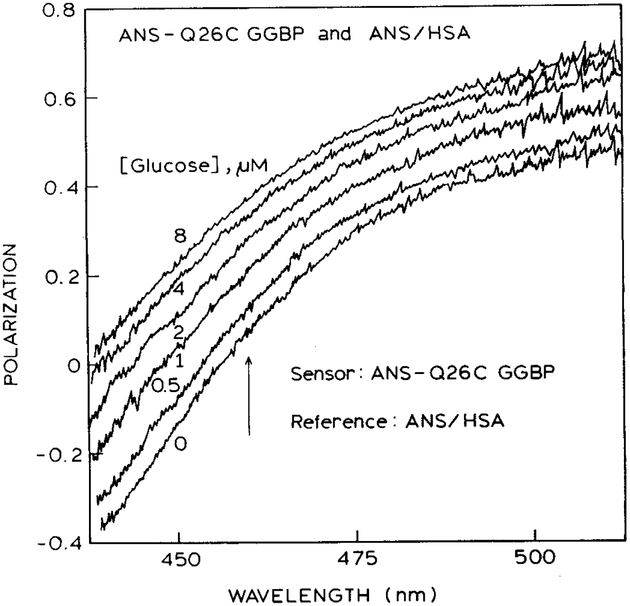
Polarization values were measured across the emission spectra from the combined sensor (Fig. 2). The polarization values increase with increasing wavelength. This effect is due to the increasing contribution of ANS/HSA at longer wavelengths, and the vertically oriented polarizer in front of ANS/HSA. The polarization values are lower and even negative at shorter wavelengths because of the shorter wavelength emission of ANS-Q26C GGBP and the horizontal polarizer in front of this sample. The polarization values were also found to be dependent on the glucose concentration. Increasing amounts of glucose result in larger polarization values. This change occurs because binding of glucose to labeled GGBP decreases its intensity. Hence the polarization shifts towards the value of +1.0—characteristic of the ANS/HSA side of the sensor.
Fig. 2.
Wavelength-dependent polarization of the combined emission from ANS-Q26C GGBP and ANS/HSA. The arrow shows the wavelength chosen for measurement of the glucose concentration.
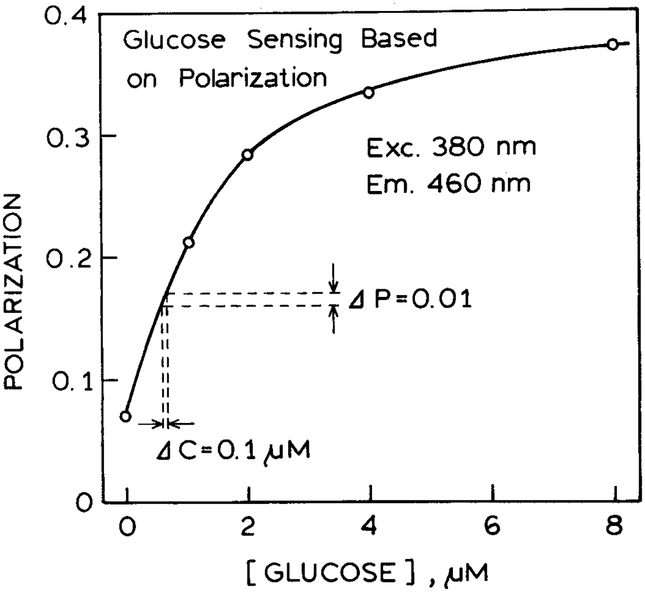
We used the glucose-dependent polarization values to develop a calibration curve for glucose (Fig. 3). It is surprising that the polarization increases substantially from 0.06 to 0.36. This range is larger than that encountered for typical polarization assays in which the polarization change is due to changes in the rotational correlation time of the fluorophore. This larger range of polarization values is the result of using a pair of orthogonally oriented polarizers as part of the sensor design. The increase in polarization is complete above 6 μM glucose. This result occurs because ANS-Q26C GGBP becomes saturated with glucose and the intensity becomes constant.
Fig. 3.
Glucose-dependent polarization values from the two-part sensor.
It is informative to consider the potential accuracy of these glucose measurements. Since polarization measurements are easily accurate to ±0.01, we estimate the accuracy in glucose concentrations to be about ±0.1 μM. In the future one can expect glucose binding proteins that display larger changes in intensity than shown by ANS-Q26C GGBP. In these cases the polarization change will be larger, and the accuracy in the glucose concentration will be higher. Of course the maximum accuracy will be found near the midpoint of the glucose-GGBP binding curve. The accuracy will decrease as the glucose concentration becomes much smaller or much larger than the glucose binding constant.
Glucose Assay with a Self-Reference.
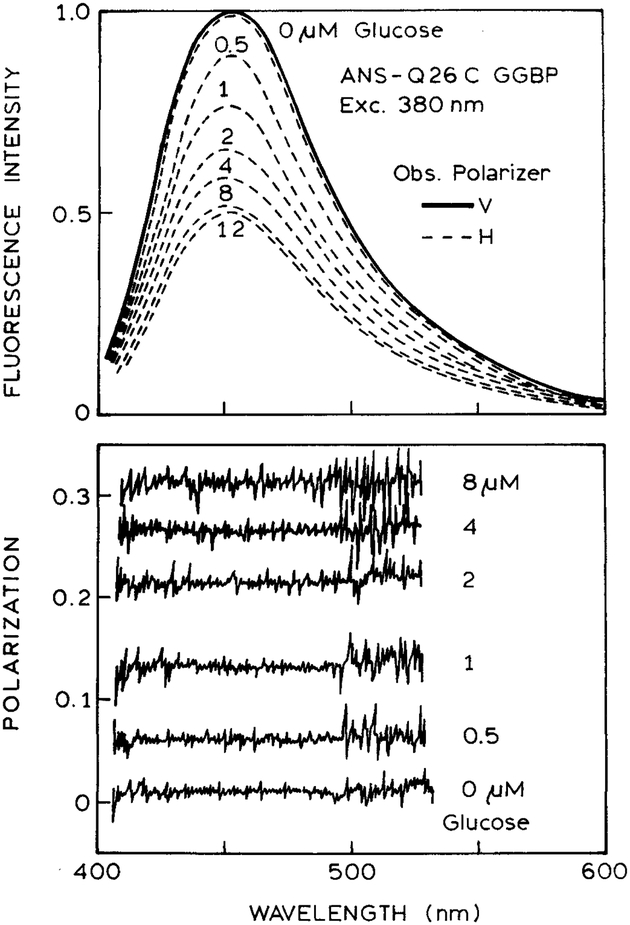
We next examined a sensor that contained ANS-Q26C GGBP on both sides of the sensor. The reference solution was observed through a vertical polarizer, and the solution with various glucose concentrations was observed through a horizontal polarizer (Fig. 4, top). When the analyze polarizer was in the vertical orientation, the emission spectrum was independent of glucose concentration (——). This result occurs because the vertical analyzer polarizer selects for emission from the reference side of the sensor. When the analyzer polarizer is in the horizontal orientation, the emission spectra display decreasing intensity with increasing glucose concentration (– – –). This result occurs because the horizontal analyzer selects the emission from the side of the sensor that contains the variable glucose concentration.
Fig. 4.
Emission spectra (top) and polarization spectra (bottom) for a two-part sensor consisting of only ANS-Q26C GGBP in both sides of the sensor. The glucose concentration was constant on the left (V) side of the sensor and was varied in the right (H) side of the sensor (see Scheme I).
We measured the polarization spectra for the combined emission from the sensor (Fig. 4, bottom). In this case the polarization values are independent of wavelength because both sides of the sensor display the same emission spectra. This is an advantage of using the sensor as the reference: there is no dependence of the polarization values on the observation wavelength. As the glucose concentration increases, the polarization increases. This increase occurs because the intensity of ANS-labeled GGBP decreases in the presence of glucose, so that the vertically polarized reference emission contributes a larger fraction to the total emission.
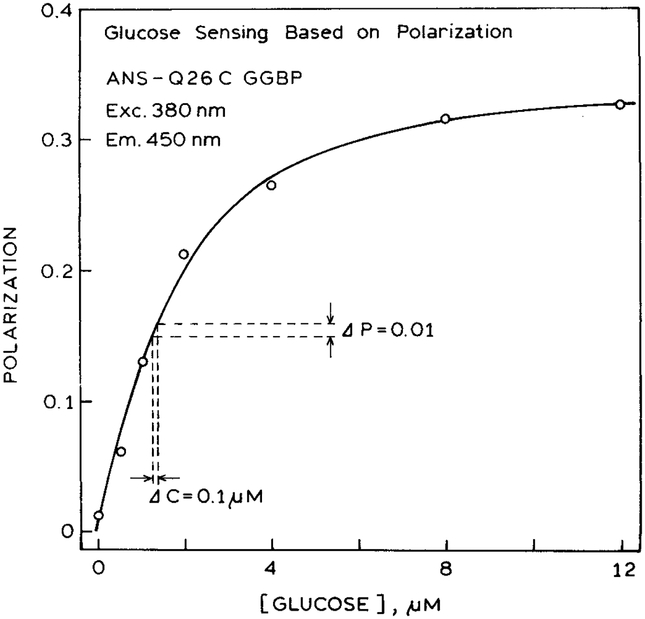
The polarization values were again used to develop a glucose calibration curve (Fig. 5). In this case the polarization changes from near zero to over 0.3. This change in polarization occurs for only a twofold change in sample intensity. Since the reference and sample are the same fluorophore, one expects both sides of the sensor to display similar photobleaching or dependence on temperature. Hence the glucose calibration curve should be stable for extended periods of time.
Fig. 5.
Glucose-dependent polarization sensing using only ANS-Q26C GGBP in both sides of the sensor.
The reader may question the usefulness of a glucose sensor with micromolar sensitivity when the concentration of glucose in the blood is near 5 mM. High glucose affinity is useful for two reasons. First, one can use a minimum volume of blood, which is then diluted into the sample in contact with the sensor. Second, there is increasing interest in the use of extracted interstitial fluid to monitor blood glucose. In this sample the glucose concentration is often in the micromolar range.37
Polarization Sensing of Calcium.
Fluorescence sensing methods are needed for a variety of cations and anions, particularly for blood gases and electrolytes. Hence we examined how our polarization sensor could be used to measure calcium. For these experiments we chose the calcium-sensitive fluorophore Fluo-3.38 This fluorophore displays a dramatic increase in fluorescence upon binding calcium, approximately 100-fold.39 While the intensity change of Fluo-3 is dramatic, there is no spectral shift upon calcium binding. Hence, wavelength-ratiometric measurements are not possible. Furthermore, Fluo-3 is not useful with lifetime-based sensing. This is because Fluo-3 is nonfluorescent in the absence of calcium. If the lifetime is measured, one observes only the emission from the calcium-bound form. Hence, the lifetimes are independent of calcium concentration.
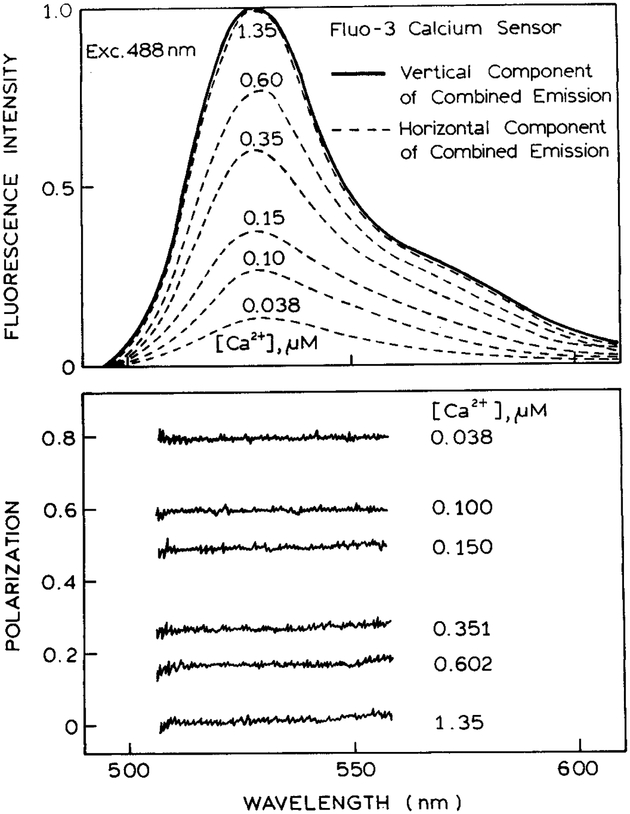
While Fluo-3 is not useful as a wavelength-ratiometric of lifetime sensor, its large change in intensity makes it well suited for use in polarization sensing. The sensor was configured with Fluo-3 in both sides. The calcium concentration was constant at 1.35 μM in the reference (vertical) side and was variable in the sample (horizontal) side of the sensor. Emission spectra were recorded through the analyzer polarizer (Fig. 6, top). The spectrum was constant with the analyzer in the vertical orientation because of the constant signal from the vertical side of the sensor. The emission spectrum seen with the analyzer in the horizontal position increases with the calcium concentration because of the intensity increase of Fluo-3.
Fig. 6.
Polarization sensing of calcium using Fluo-3. The top panel shows the emission spectra of the vertical component (Scheme I, R) and of the horizontal component (Scheme I, S). The calcium concentration is constant at 1.35 μM in the left side (R) of the sensor. The calcium concentration is variable in the right side of the sensor (S). The lower panel shows the polarization across the emission spectra.
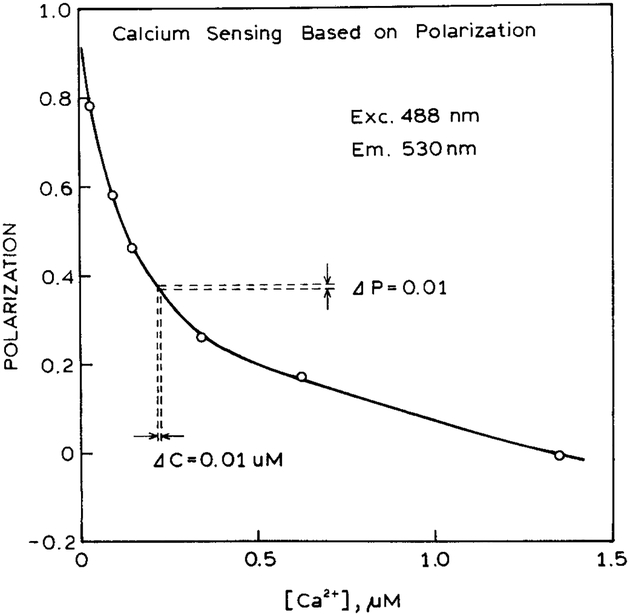
Since the sensor contained Fluo-3 on both sides, the polarization was independent of wavelength (Fig. 6, bottom). The polarization decreased dramatically from 0.8 to 0.0 with increasing calcium concentrations. The decrease in polarization occurs because the intensity from the horizontally polarized side of the sensor increases as the calcium concentration increases. The calibration curve for the polarization values (Fig. 7) shows a dramatic dependence on the calcium concentration. In this case the calcium concentrations are expected to be accurate to ±0.01 μM. Once again, since the same fluorophore is present on both sides of the sensor, one expects similar changes in the emission due to temperature or photobleaching. Hence one can anticipate a stable calcium calibration curve. If desired, the polarization could increase with higher calcium concentrations by reversing the sample and reference in Scheme I. The calcium-sensitive range is from 0 to 400 nM Ca2+, which is the typical range for intracellular calcium.
Fig. 7.
Calcium-dependent polarization values using only Fluo-3 in both sides of the sensor.
Glucose and Calcium Sensing with Visual Detection.
In another report we described polarization sensing with visual detection.36 The basic idea is to visually observe the emission from both sides of the sensor through an analyzer polarizer (Scheme II). The analyzer is rotated until the adjacent intensities from the vertically and horizontally polarized emission are equalized. The angle of the analyzer polarizer is used to determine the analyte concentration.
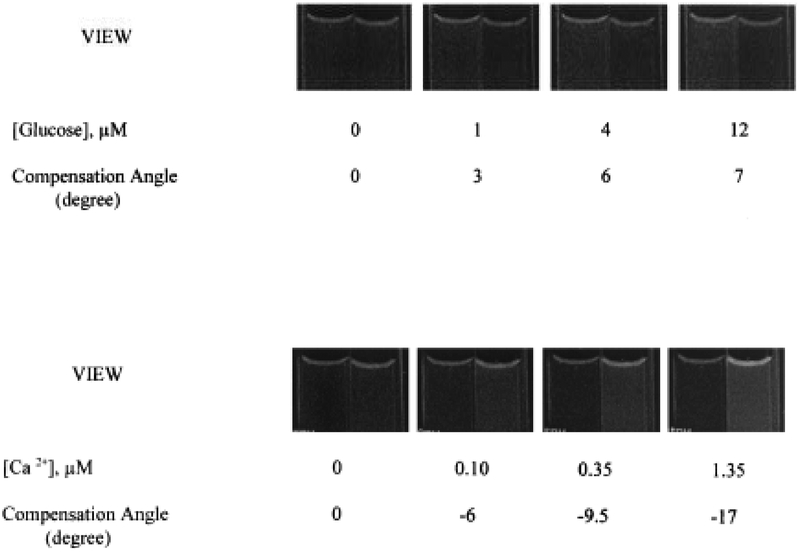
We applied this method to sensing of glucose and calcium, using the apparatus shown in Scheme II. The images seen through the analyzer polarizer are shown in Fig. 8. For these images the initial angular rotation of the analyzer (α0) was adjusted to match the intensities seen from both sides of the sensor. The images were then recorded for various analyte concentrations, with the analyzer left in the same angular position (α0). As the glucose concentration increases, the intensity from the horizontal (right) side of the sensor decreases, as can be seen in the top panel of Fig. 8. As the calcium concentration increases, the intensity in the horizontal (right) side of the sensor increases, as can be seen in the lower panel.
Fig. 8.
Images seen through the analyzer for different concentrations of glucose (top) and calcium (bottom). In each case the initial angle of the analyzer was adjusted to yield equal intensities in the absence of glucose on calcium. The images were then recorded at this same analyzer angle. The values under the images are the analyzer angles needed to equalize the intensities, not the angle needed to equalize the intensities.
The angular position of the analyzer can be adjusted to yield visually equivalent intensities. These angles are shown under the images in Fig. 8. For glucose the angles of the analyzer must be increased to equalize the intensities. This effect is due to the decreased horizontal intensity, as well as the need to increase the horizontal intensity to visually match both sides of the sensor. For increasing concentrations of calcium, the angle of the analyzer must be decreased to equalize the intensities. This direction of change is needed because the increased intensity from the horizontal component must be attenuated to yield visually equivalent intensities.
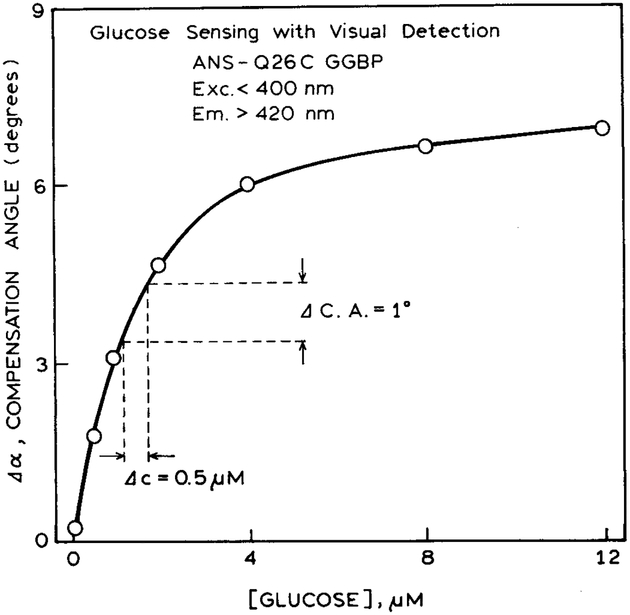
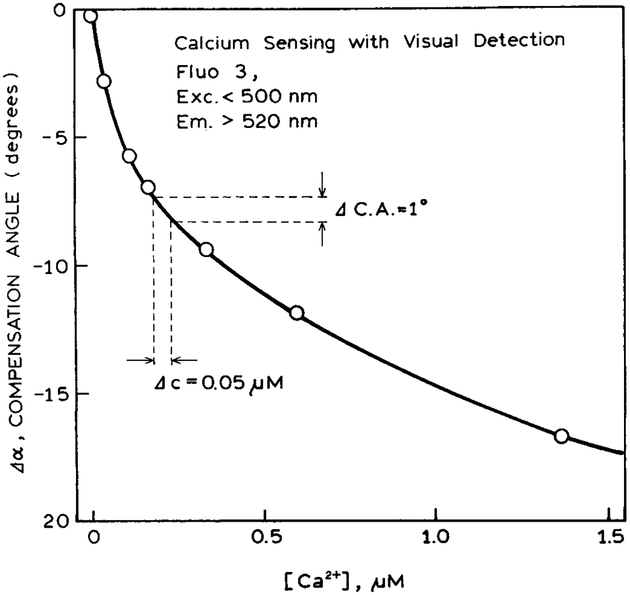
Figures 9 and 10 show the calibration curves for the compensation angles for glucose and calcium, respectively. In another report we found that the compensation angles are typically accurate to one or two degrees.36 An accuracy of 1° in the compensation angle results in an accuracy of ±0.5 μM in glucose and ±0.05 μM in calcium, as found for the most sensitive part of the curve. While the accuracy is somewhat less than that available with electronic detection, the accuracy may be adequate for some clinical or analytical applications, particularly where a yes/no answer is adequate.
Fig. 9.
Calibration curve for glucose sensing with visual detection.
Fig. 10.
Calibration curve for calcium sensing with visual detection.
DISCUSSION
What are the advantages of the polarization sensing schemes described above? One advantage is the need for just one fluorophore, which is used in both sides of the sensor. This arrangement should result in stable calibration curves that are insensitive to many instrumental or chemical changes in the sample. Another advantage is the wide dynamic range of polarization values, from +1.0 to −1.0. Importantly, this range of values is available without any change in the actual polarization of the emission of the sensing fluorophores. The polarization values of +1.0 and −1.0 are imposed on the sensor by the use of polarizers through which the emission is observed.
Perhaps the most important characteristic of polarization sensing is that the approach is generic and can be used in any situation where an intensity change occurs. For instance, intensity changes occur for the sodium and potassium probes SBFI and PBFS,40 but the spectral shifts are rather small. As shown for the glucose sensor, a twofold change in intensity is easily adequate for a polarization sensor. Also, polarization sensing can be used for collisional-quenched fluorophores that do not display spectral shifts. Hence, one can imagine polarization sensors for Na+, K+, Mg2+, Cl−, pH, and O2, to name a few.
It is also important to recognize the increasing availability of intensity-based fluorophores for glucose. These probes contain boron and depend on binding of the glucose diol to the boron, resulting in a change in probe intensity.41–45 Such glucose-specific fluorophores could be used with polarization sensing to develop low-cost devices for measuring glucose in blood.
In summary, polarization sensing provides a simple method to convert any change in intensity into a change in polarization. The use of polarizers within the sensor design results in a wide range of polarization values. Polarization sensors can most probably be designed with solid-state light sources and detectors, making clinical measurements available for point-of-care applications.
ACKNOWLEDGMENT
This work was supported by a grant from the National Institutes of Health National Center for Research Resources, RR-08119, RR-10955, and RR-14170.
APPENDIX
In the case of glucose sensing, the labeled protein provided only a modest twofold change in intensity in response to glucose. When one is using visual detection with such sensors, it is important to select initial conditions that result in the largest overall change in α. Suppose the initial (0) polarized intensities of the sample and reference are I0S and I0R, where we have dropped the polarization subscript for simplicity. According to Eq. 8 the initial angle is given by
| (A1) |
where n equals the initial intensity ratio. Hence
| (A2) |
Now suppose the addition of analyte changes the intensity on the sample side of the sensor by a factor α. The sample intensity is then given by
| (A3) |
The compensation angle needed to equalize the intensities is then given by
| (A4) |
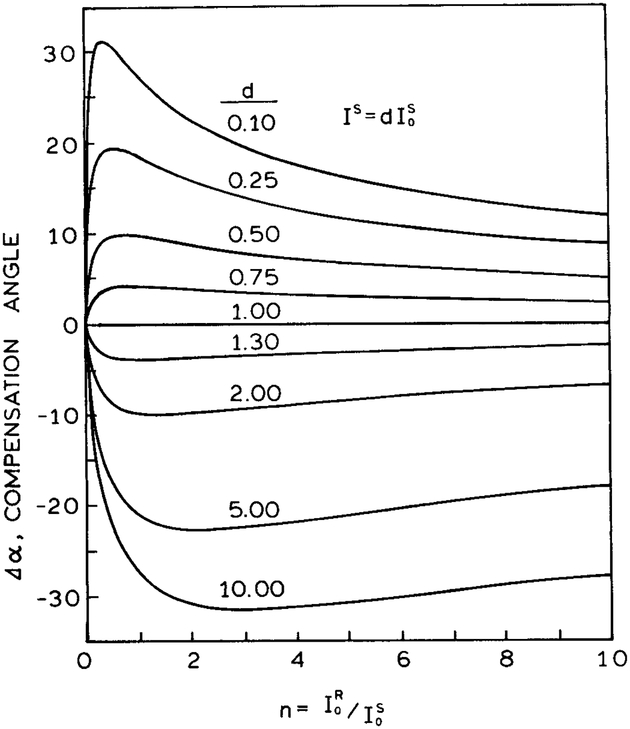
Hence, the change in compensation angle for a factor of d change in sample intensity is given by
| (A5) |
Fig. 11.
Effect of the initial conditions on the total change in angle for visual sensing.
We used Eq. A5 to calculate the values of n needed to obtain the maximum changes in α. These simulations are shown in Fig. 11. The calcium sensor displays a large increase in intensity upon binding calcium; that is, d is larger than 10. For this situation, it is preferable to chose the initial conditions so that n is near 3; that is, the reference is about threefold more intense than the sample. For the glucose sensor, the intensity decreases upon glucose binding, and d is near 0.5. In this case it is desirable to begin the experiment with n near 0.5, which is the case where the sensor is about twofold more fluorescent than the reference.
References
- 1.Spichiger-Keller UE, Chemical Sensors and Biosensors for Medical and Biological Applications (Wiley–VCH, New York, 1998), p. 413. [Google Scholar]
- 2.Fiber Optic Chemical Sensors and Biosensors, Wolfbeis OS, Ed. (CRC Press, Boca Raton, Florida, 1991), Vol. II, p. 358. [Google Scholar]
- 3.Sensors and Actuators B, Proceedings of the 3rd European Conference on Optical Chemical Sensors and Biosensors, Part I: Plenary and Parallel Sessions; Part II: Poster Sessions,Kunz RE, Ed. (Elsevier, New York, 1996). [Google Scholar]
- 4.Topics in Fluorescence Spectroscopy, Vol. 4, Probe Designand Chemical Sensing,Lakowicz JR, Ed. (Plenum Press, New York, 1994), p. 501. [Google Scholar]
- 5.Advances in Fluorescence Sensing Technology III, SPIE Proc Vol. 2980, Thompson RB, Ed. (SPIE, Bellingham, Washington, 1997), p. 582. [Google Scholar]
- 6.Fabbrizzi L, Licchelli M, Parodi L, Poggi A, and Taglietti A, J. Fluoresc 8, 263 (1998). [Google Scholar]
- 7.Roshal AD, Grigorovich AV, Doroshenko AO, Pivovarenko VG, and Demchenko AP, J. Phys. Chem. A 102, 5907 (1998). [Google Scholar]
- 8.Prodi L, Bolletta F, Zaccheroni N, Watt CIF, and Mooney NJ, Chem. Eur. J 4, 1090 (1998). [Google Scholar]
- 9.Chenthamarakshan CR and Ajayaghosh A, Tetrahedron Letts. 39, 1795 (1998). [Google Scholar]
- 10.Metzger A and Anslyn EV, Angew. Chem. Int. Ed 37, 649 (1998). [DOI] [PubMed] [Google Scholar]
- 11.Kao JPY, Methods in Cell Biology (Academic Press, New York, 1994), Vol. 40, pp. 155–181. [DOI] [PubMed] [Google Scholar]
- 12.Tsien RY, Methods in Cell Biology (Academic Press, New York, 1989), pp. 127–156. [DOI] [PubMed] [Google Scholar]
- 13.Akkaya EU and Lakowicz JR, Anal. Biochem 213, 285 (1993). [DOI] [PubMed] [Google Scholar]
- 14.Illner H, McGuigan JAS, and Lüthi D, Pflugers Arch 422, 179 (1992). [DOI] [PubMed] [Google Scholar]
- 15.Raju B, Murphy E, Levy LA, Hall RD, and London RE, Am. J. Physiol 256, C540 (1989). [DOI] [PubMed] [Google Scholar]
- 16.Whitaker JE, Haugland RP, and Predengast G, Anal. Biochem 194, 330 (1991). [DOI] [PubMed] [Google Scholar]
- 17.Verkman AS, Sellers MC, Chao AC, Leung T, and Ketcham R, Anal. Biochem 178, 355 (1989). [DOI] [PubMed] [Google Scholar]
- 18.Biwersi J, Tulk B, and Verkman AS, Anal. Biochem 219, 139 (1994). [DOI] [PubMed] [Google Scholar]
- 19.Mills A, and Williams FC, Thin Solid Films 306, 163 (1997). [Google Scholar]
- 20.Hartman P and Leiner MJP, Anal. Chem 6, 88 (1995). [Google Scholar]
- 21.Xu W, Kneas KA, Demas JN, and DeGraf BA, Anal. Chem 68, 2605 (1996). [DOI] [PubMed] [Google Scholar]
- 22.Klimant I, Belser P, and Wolfbeis OS, Talanta 41, 985 (1994). [DOI] [PubMed] [Google Scholar]
- 23.Chuang H and Arnold MA, Anal. Chim. Acta 368, 83 (1998). [Google Scholar]
- 24.Szmacinski H and Lakowicz JR, in Topics in Fluorescence Spectroscopy, Vol. 4, Probe Design and Chemical Sensing, Lakowicz JR, Ed. (Plenum Press, New York, 1994), pp. 295–334. [Google Scholar]
- 25.Szmacinski H and Lakowicz JR, Sensors and Actuators B 29, 30 (1995). [DOI] [PMC free article] [PubMed] [Google Scholar]
- 26.Lippitsch ME, Draxler S, and Kieslinger D, Sensors and Actuators B 38–39, 96 (1997). [Google Scholar]
- 27.Lippitsch ME, Pusterhofer J, Leiner MJP, and Wolfbeis OS, Anal. Chim. Acta 205, 1 (1988). [Google Scholar]
- 28.Neurauter G, Klimant I, Liebsch G, Kosch U, and Wolfbeis OS, Europt(r)ode IV (German Chemical Society, Munich, 1998), pp. 231–232. [Google Scholar]
- 29.Klimant I and Wolfbeis OS, Europt(r)ode IV (German Chemical Society, Munich, 1998), pp. 125–126. [Google Scholar]
- 30.Tolosa L, Gryczynski I, Eichhorn L, Dattelbaum JD, Castellano FN, Rao G, and Lakowicz JR, Anal. Biochem 267, 114 (1999). [DOI] [PMC free article] [PubMed] [Google Scholar]
- 31.Lakowicz JR, Castellano FN, Dattelbaum JD, Tolosa L, Rao G, and Gryczynski I, Anal. Chem 70, 5115 (1998). [DOI] [PMC free article] [PubMed] [Google Scholar]
- 32.Sipior J, Carter GM, Lakowicz JR, and Rao G, Rev. Sci. Instrum 68, 2666 (1997). [Google Scholar]
- 33.Sipior J, Carter GM, Lakowicz JR, and Rao G, Rev. Sci. Instrum 67, 3795 (1996). [Google Scholar]
- 34.Fantini S, Franceschini MA, Fishkin JB, Barbieri B, and Gratton E, Appl. Opt 33(22), 5204 (1994). [DOI] [PubMed] [Google Scholar]
- 35.Randers-Eichhorn L, Albano CR, Sipior J, Bentley WE, and Rao G, Biotech. Bioeng 55, 921 (1997). [DOI] [PubMed] [Google Scholar]
- 36.Gryczynski I, Gryczynski Z, and Lakowicz JR, Anal. Chem, paper in press (1999). [DOI] [PMC free article] [PubMed] [Google Scholar]
- 37.Tamada JA, Bohannon NJV, and Potts RO, Nature Medicine 2, 1198 (1995). [DOI] [PubMed] [Google Scholar]
- 38.Minta A, Kao JPY, and Tsien RY, J. Biol. Chem 264, 8171 (1989). [PubMed] [Google Scholar]
- 39.Haugland RP, Handbook of Fluorescent Probes and Research Chemicals (Molecular Probes, Eugene, Oregon, 1996), 6th ed. p. 511. [Google Scholar]
- 40.Minta A and Tsien RY, J. Biol. Chem 264, 19449 (1982). [PubMed] [Google Scholar]
- 41.Takeuchi M, Imada T, and Shinkai S, J. Am. Chem. Soc 118, 10658 (1996). [Google Scholar]
- 42.Kataoka K, Hisamitsu I, Sayama N, Okano T, and Sakurai Y, J. Biochem 117, 1145 (1995). [DOI] [PubMed] [Google Scholar]
- 43.Sandanayake KRAS, James TD, and Shinkai S, Pure Appl. Chem 68, 1207 (1996). [Google Scholar]
- 44.Yamamoto M, Takeuchi M, and Shinkai S, Tetrahedron 54, 3125 (1998). [Google Scholar]
- 45.Takeshita M, Uchida K, and Irie M, Chem. Commun 1807 (1996). [Google Scholar]


