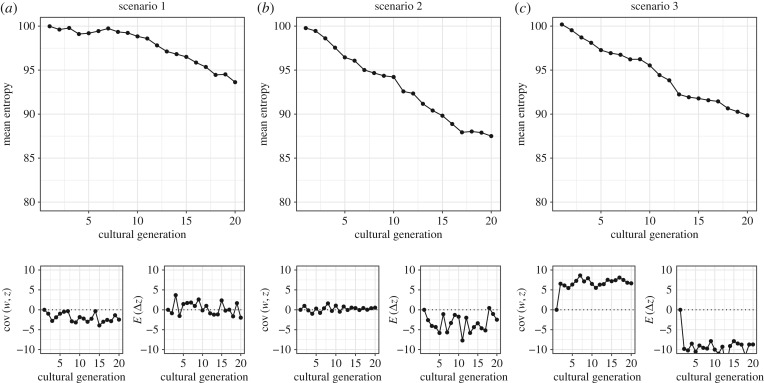
Figure 2.
Simulations of change in the entropy of song style under three evolutionary scenarios. In each column (a–c), the main plot shows the change in the population mean of the entropy of song styles over 20 generations. The bottom left inset shows the covariance between fitness (number of learners each ancestor attracts) and entropy. The bottom right shows the mean value of the entropy difference between a descendant's productions and the average of those of their ancestors. Panels (a–c) correspond, respectively, to the three scenarios explained in §3a. All simulations are based on a population size of 1000, with each descendant learning from five ancestors.

