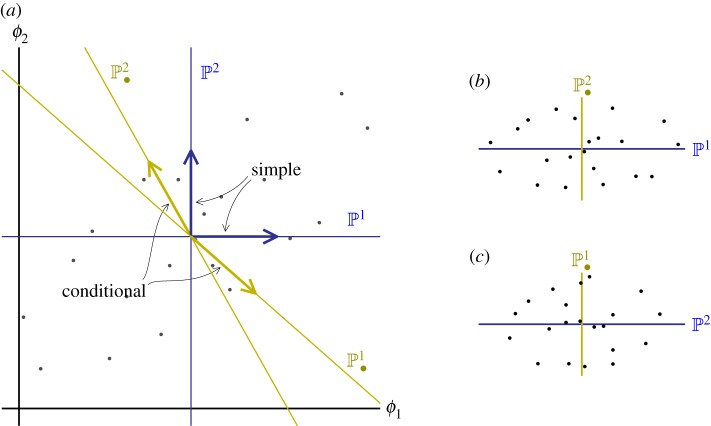
Figure 3.
(a) Simple and conditional bases for two traits in a population (grey dots denote individuals) in which the traits are positively correlated. The simple bases are just the trait values with the means subtracted out. The conditional bases are constructed so that is orthogonal to , and is orthogonal to . (Note that, because ϕ1 and ϕ2 are correlated, orthogonality does not correspond to right angles in this system.) (b,c) Projection of the points into the two pairs of orthogonal bases. (Online version in colour.)

