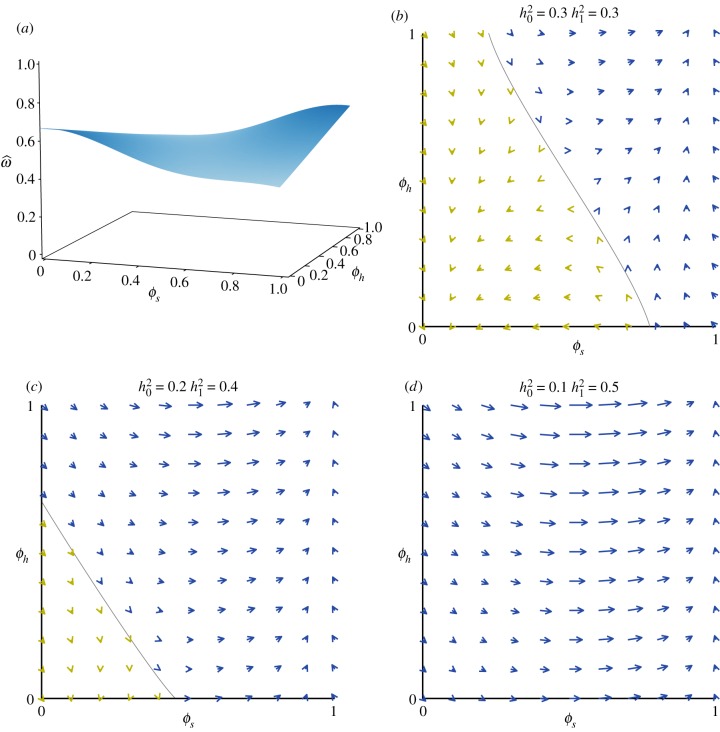
Figure 4.
(a) A fitness landscape for two traits when individuals encounter one of two environments. ϕs has different optima in the two environments (ϕs = 0 optimum in environment 0, ϕs = 1 optimum in environment 1), and ϕh determines the probability that an individual encounters one or the other environment. (b–d) Vectors of evolutionary change at different starting points. The diagonal grey line in (b) and (c) indicates the boundary between points from which the population eventually evolves towards (0,0) and the points from which it eventually evolves towards (1,1). (Online version in colour.)

