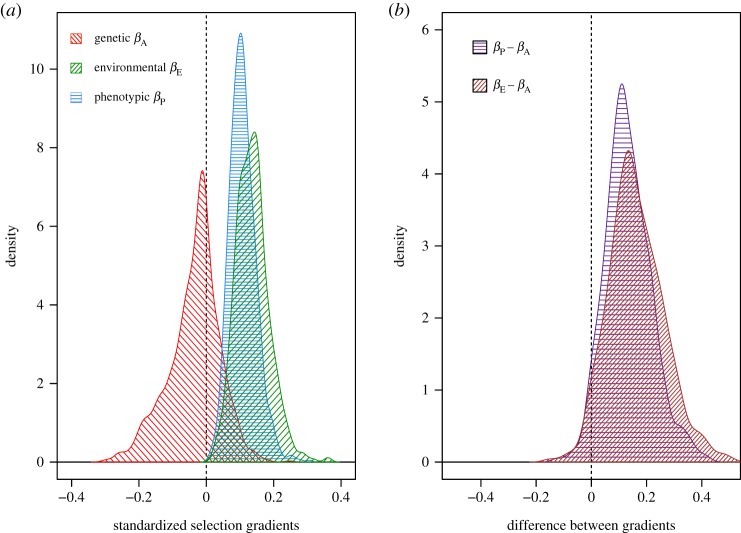
Figure 3.
Posterior distributions of the estimates of the selection gradients for nestling mass. (a) Genetic and non-genetic gradients: red diagonal hashed lines indicate the additive genetic gradient βA, green diagonal lines indicate the environmental (non-genetic) gradient βE and blue horizontal lines indicate the phenotypic gradient βP. (b) Tests of equivalence of gradients. Purple horizontal lines indicate the difference between the phenotypic and genetic gradients, and brown diagonal lines indicate the difference between environmental and genetic gradients. (Online version in colour.)

