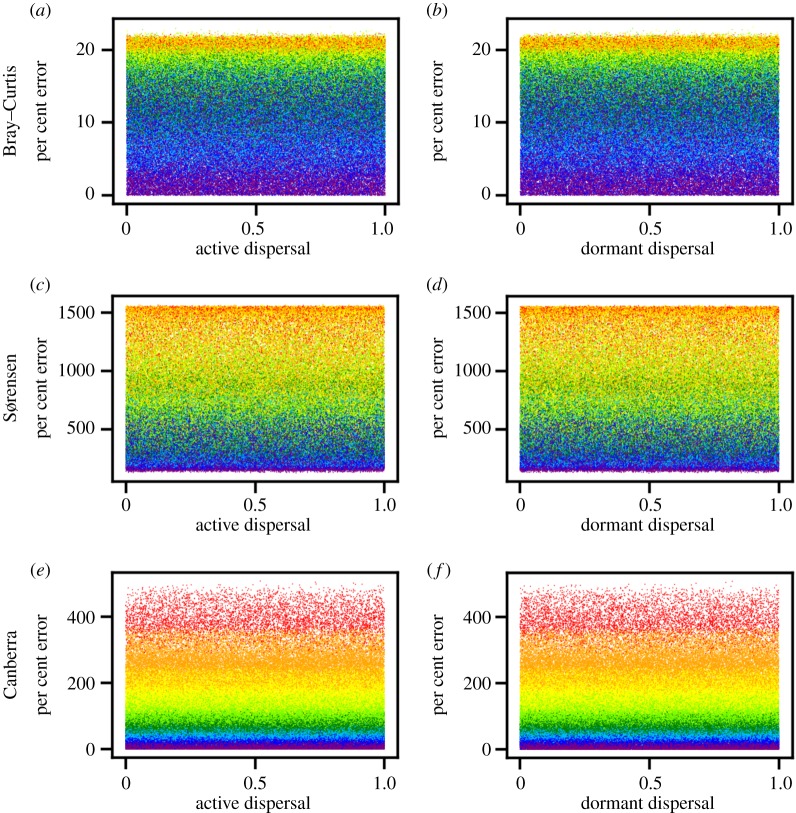
Figure 4.
Average per cent error between slopes of environmental distance–decay relationships (DDRs) from the field survey and slopes of environmental DDRs from simulated communities versus randomly drawn values of active and dormant dispersal parameters. Community similarity is based on the Bray–Curtis (a,b), Sørensen (c,d), and Canberra (e,f) metrics. Each point represents the result of a single model and is coloured according to the value of environmental filtering.

