Figure 1.
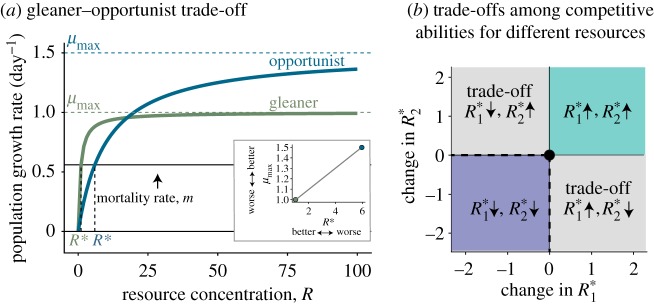
(a) Two example Monod curves [22], describing resource-dependent population growth rates, demonstrate a gleaner–opportunist trade-off (i.e. a trade-off between individuals that have high growth rates at low-resource levels (green curve, gleaner), and lower growth rates at high resource levels compared with opportunists (blue curve, opportunist)). R* are the resource concentrations at which population growth rate is zero. Here, we show a mortality rate of 0.56 day−1, consistent with the dilution rate in our experiments. A gleaner–opportunist trade-off may be detected empirically by a positive relationship between μmax and R* (inset). (b) Trade-offs may arise when adaptation to one environment comes at the cost of performance in a different environment (e.g. top left and lower right quadrants), here shown in terms of changes in R* for two resources (R*1, R*2) of descendant populations relative to their ancestors (black dot in centre). Alternatively, adaptation may arise via improvement in multiple traits simultaneously (e.g. lower left quadrant), or conditional neutrality (i.e. improvements in one trait dimension, but no cost in another, black dashed lines). Maladaption may occur if there are losses of performance in multiple traits simultaneously (upper right quadrant).

