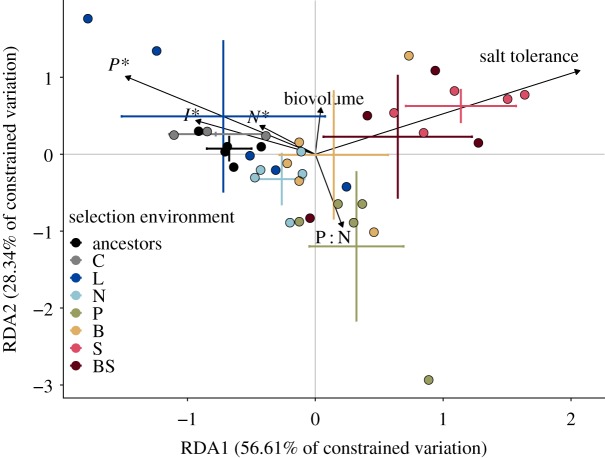
Figure 3.
RDA of N*, I*, P*, salt tolerance, consumption vectors and cell biovolume across selection environments. Error bars correspond to standard error around treatment means (n = 5 per treatment). RDA axes 1 and 2 (PERMANOVA p < 0.01) explain 85% of the variation associated with selection environment and 36% of the total variation.

