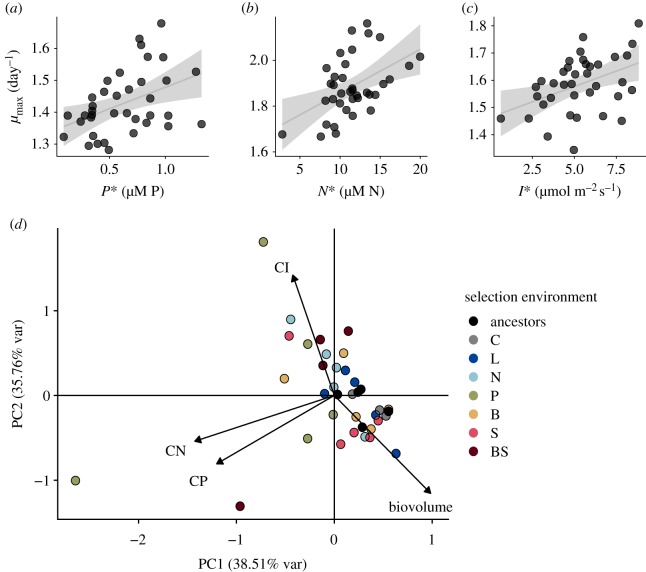
Figure 4.
High maximum population growth rates (μmax) are positively associated with high minimum resource requirements for phosphorus (a), nitrogen (b) and light (c). Estimates of μmax and R* in (a–c) are from Monod curves generated over independent gradients of phosphorus, nitrogen and light. (d) Loadings on the first two PC axes of a PCA using competitive abilities for phosphorus, nitrogen and light (CP = 1/P*, CN = 1/N*, CI = 1/I*) and cell biovolume; 74.3% of the variation in resource-use traits and cell size is explained by the first two PC axes.

