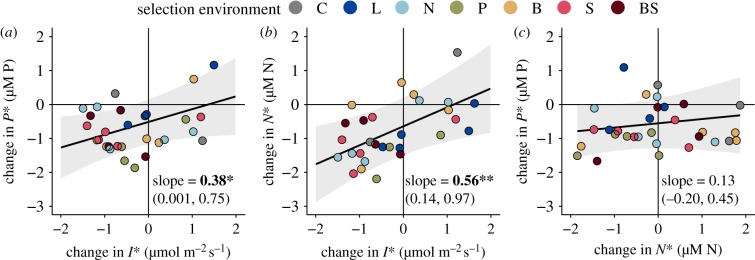
Figure 5.
(a–c) Partial regression plots showing how changes in descendants relative to ancestors in two traits are related to each other, while holding all factors in the statistical model that are not being displayed constant (complete model results in electronic supplementary material, tables S1–S3). Positive slopes indicate positively associated trait changes. *p < 0.1; **p < 0.05.

