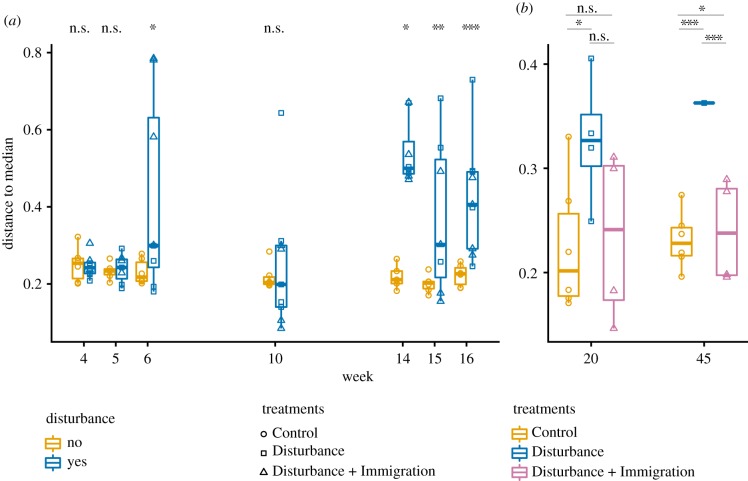
Figure 5.
Changes in beta dispersion over the disturbance experiment. Beta dispersion, an indicator of variability in community structure, was quantified using the distance to the median in ordination space (figure 4), which was constructed based on Bray–Curtis dissimilarity. (a) Changes in beta dispersion in Control (gold, circles) and Disturbance (blue, squares and triangles) mesocosms over the thermal press (weeks 4–16). (b) Changes in beta dispersion in Control, Disturbance (blue squares) and Disturbance + Immigration (pink triangles) mesocosms over the recovery period, weeks 20–45. The Disturbance + Immigration mesocosms received a dispersal event at week 17. Asterisks indicate significant differences with a Tukey's honestly significant difference post hoc test (n.s., not significant; *p < 0.1, **p < 0.01, ***p < 0.001). Note differences in y-axis ranges between (a) and (b).

