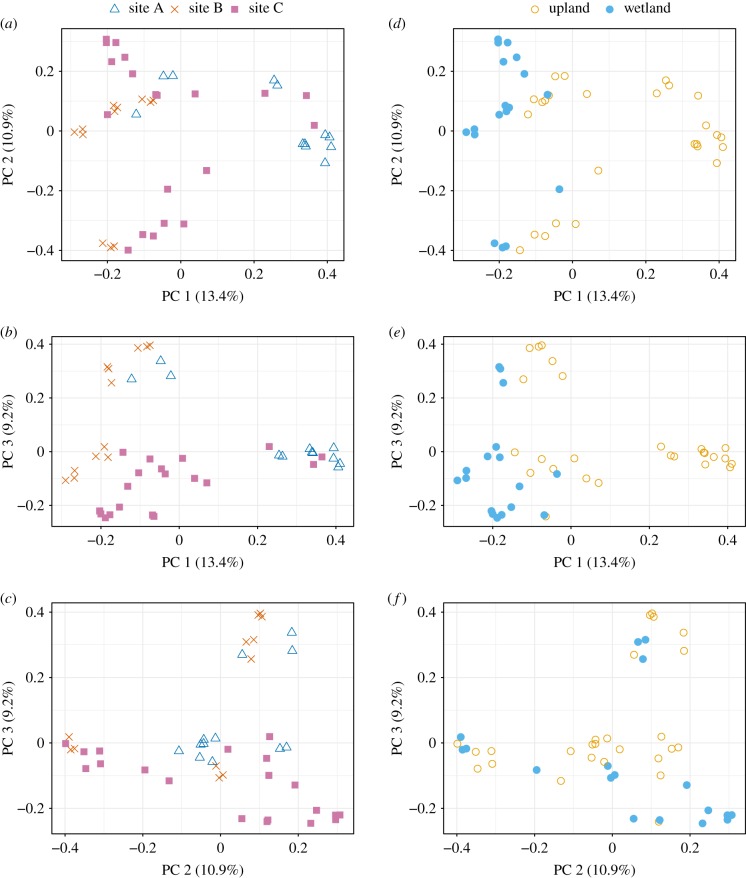
Figure 2.
Microbial community composition is spatially and environmentally structured. Principal coordinate plots of Bray–Curtis distance representing the first three axes of community composition. In (a–c) points are identified by site ID, and in (d–f) points are identified by wetland or upland ecosystem. All four environmental covariates separate strongly by wetland/upland. Axis length is proportional to variance explained as indicated in parentheses. PC, principal coordinate. (Online version in colour.)

