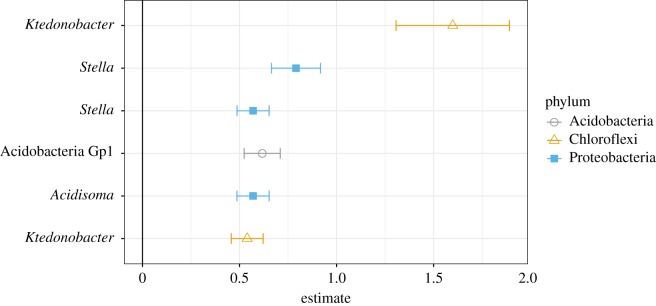
Figure 3.
Taxa associated with methane oxidation rates after controlling for geographic location, environmental similarity and community composition. Points are estimates for the linear relationship between the relative abundance of a single ASV and methane oxidation rate with standard errors from variance component models including similarity matrices as covariates for community and environment and site ID for geographic location. Amplicon sequence variants are labelled at the finest resolution available: genus for all except the Group 1 Acidobacteria. Points are identified by phylum. Significant taxa were determined by controlling the false discovery rate at q-value < 0.05. (Online version in colour.)

