Figure 5.
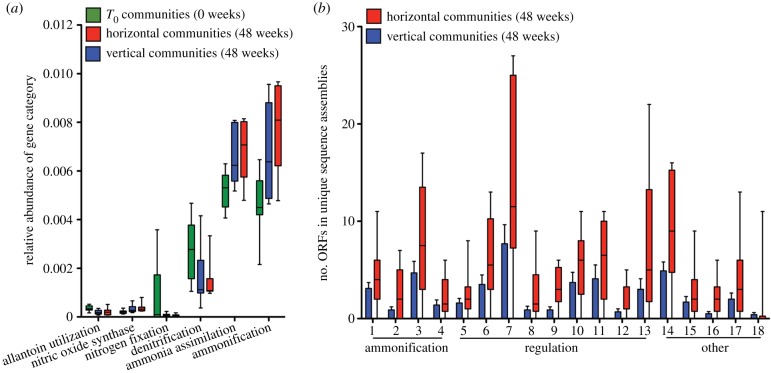
Enrichment of nitrogen metabolism genes in HCs. (a) Relative abundance of nitrogen metabolism gene categories based on sequence annotation using MG-RAST. Data are shown as box and whisker plots depicting median, interquartile range (box) and full data spread from 10 replicate communities. (b) Total number of ORFs predicted to encode-specific domains associated with ammonification, regulation of nitrogen metabolism and other associated nitrogen metabolism genes in the assemblies of unique vertical and unique horizontal sequences. Data are shown as box and whisker plots depicting median, interquartile range (box) and full data spread from 10 replicate mesocosms. 1, NifS; 2, NifE; 3, NapA; 4, nitrilase; 5, NtrA; 6, NifR3; 7, NtrY; 8, NifL; 9, PtsN; 10, NtrB; 11, NtrC; 12, NAC; 13, FixI; 14, FixG; 15 and 16 nitroreductases; 17, arginase; 18, cytochrome D1. Full descriptions of domains are provided in the electronic supplementary material, table S9.

