Figure 6.
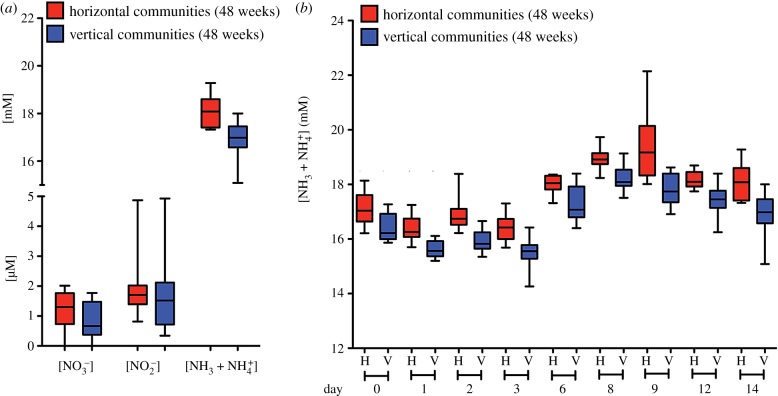
Enhanced ammonia production in HCs. (a) Concentrations of nitrate, nitrite, and ammonia/ammonium from mesocosms subject to horizontal and vertical regimes at 48 weeks (T24). Data are shown as box and whisker plots depicting median, interquartile range (box) and full data spread from 10 replicate communities. To test for differences in nitrate, nitrite and ammonia/ammonium concentrations at time T24 the 10 communities in vertical and horizontal regimes (three independent measures per community) were compared using a two-sample Kolmogorov–Smirnov test (implemented in python 3.7.2, package scipy 1.3.1). Nitrate and nitrite concentration distributions are not significantly different in the horizontal compared to vertical regime (both p > 0.1). However, the distribution of ammonia/ammonium concentrations were significantly different (K-S statistic = 0.6, n = 30 per sample, p < 0.001). Analysis was repeated using a linear mixed effect model. Community identity (1–10) was assigned as a random effect and regime (horizontal/vertical) as a fixed effect (implemented in python 3.7.2, package stats model 0.10.2, restricted maximum-likelihood fit). Results are in agreement with the K-S test. Nitrate and nitrite concentrations were not significantly affected by regime (for both Wald-test results, p > 0.3). However, the concentration of ammonia/ammonium was significantly higher in the horizontal regime (mean effect = 1.207, s.d. = 0.151, 95% confidence interval: (0.912, 1.503), n = 60, Wald-test, p < 0.001). (b) Ammonia/ammonium concentrations measured at nine time points during the two-week incubation period for communities from horizontal and vertical regimes at 48 weeks. Data are shown as box and whisker plots depicting median, inter quartile range (box) and full data spread from 10 replicate communities (triplicate measures were obtained from each community on each occasion). Analysis of time-series data using a mixed ANOVA design showed a significant effect of treatment (horizontal versus vertical; p = 1.96 × 10⁻⁵) and a significant effect of time (p = 2.7 × 10⁻²⁴, after Greenhouse & Geisser correction for sphericity). The interaction between treatment regime and time was not significant p = 0.69). Comparison between the vertical regime at 48 weeks (T24) and community function at the beginning of the experiment (T0) showed no difference (see the electronic supplementary material, figure S9).

