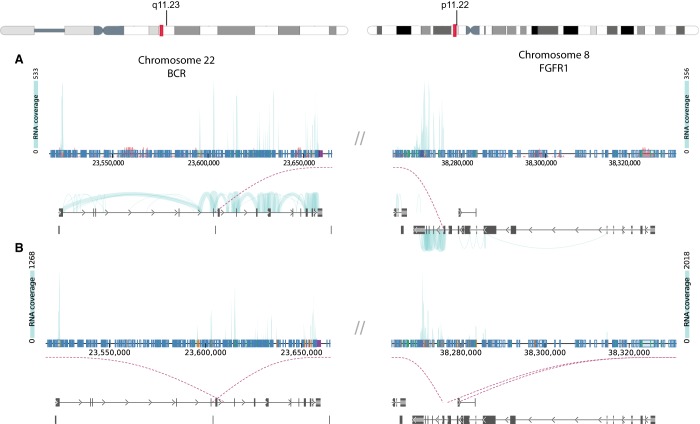
Figure 1.
RNA sequencing (RNA-seq) identified potential BCR–FGFR1 fusions in two leukemia patient samples. DNA fusion report from the Vizome data visualization tool (www.vizome.org) were used to identify t(8,22) translocations corresponding to the BCR–FGFR1 gene fusion. For Case 1 (A) and Case 2 (B), the top schematic illustrates the results of the RNA sequencing, which identified a probable BCR–FGFR1 fusion. The height of the light blue plot illustrates the number of reads spanning each exon. Plots on the bottom illustrate the location of the translocation on each chromosome. Vertical blue and black bars in the bottom illustrations indicate exons of the respective gene, and the arrows indicate the direction of the forward reading frame. The purple dotted lines connect the two chromosomes together and identify the location of the suspected translocation. The chromosome schematics at the top of the figure identify the location of the potential translocation on the actual chromosome.

