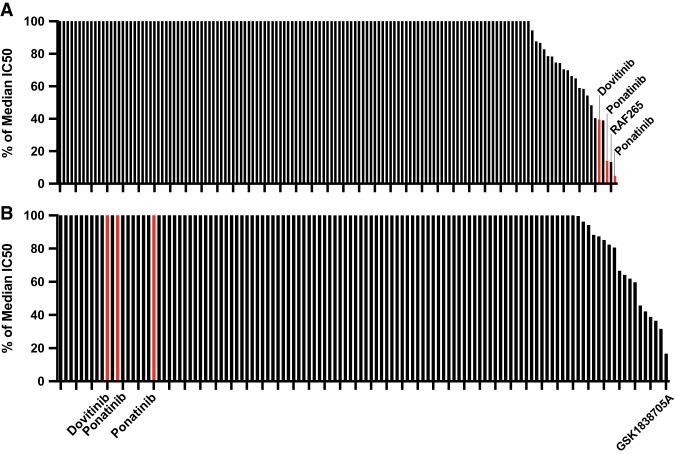
Figure 4.
Case 1 samples demonstrate sensitivity to ponatinib and dovitinib, whereas Case 2 samples demonstrate resistance. Patient bone marrow cells were cultured for 3 d in gradients of small-molecule inhibitors to evaluate drug sensitivity patterns. The graphs show percent (%) of the median IC50 for cells from Case 1 (A) and Case 2 (B). Dovitinib and ponatinib results are highlighted in both cases. Additional sensitive inhibitors were also labeled in their respective cases. Drugs are considered highly sensitive for a given patient if they are < 20% of the median IC50, and in both cases, percent median IC50 values were capped at 100%. A full list of tested inhibitors and their drug sensitivity results is provided in Supplemental Table 2.

