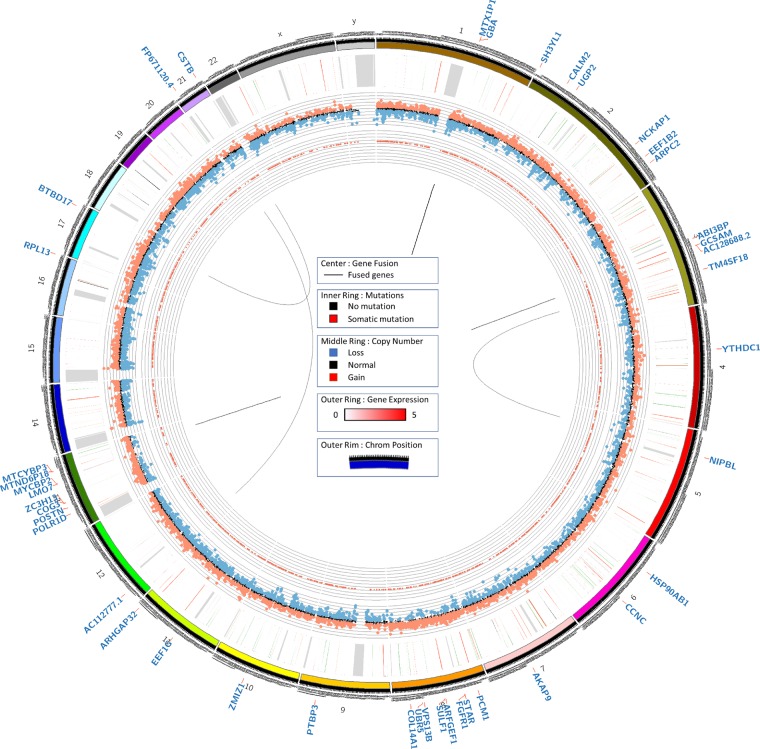
Figure 3.
Circos plot. Circos plots were generated using tumor DNA exome, normal DNA exome, and tumor RNA sequencing data. Exome data was analyzed for somatic point mutation, indel, and copy-number variation data, as denoted by the inner and middle rings, respectively. Gene expression from RNA sequencing data was plotted on the outer ring.

