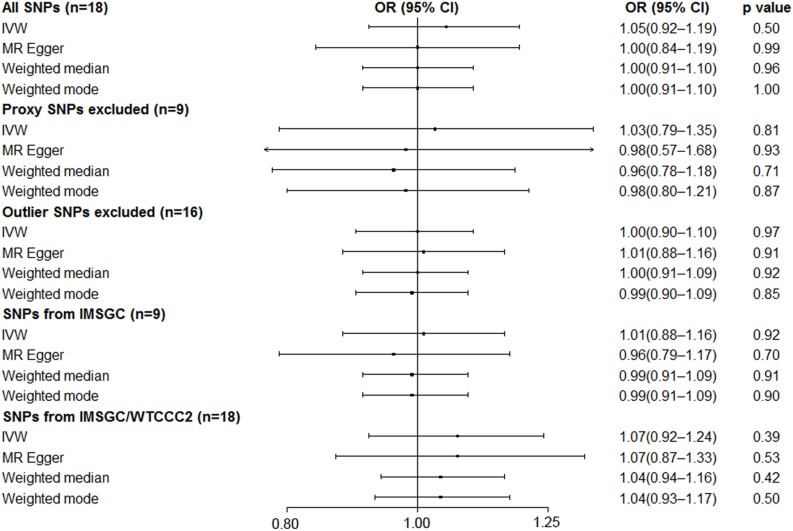
FIGURE 3.
Mendelian randomization analyses of serum uric acid level on risk of multiple sclerosis. Abbreviations: CI = confidence interval; OR = odds ratio; IMSGC = International Multiple Sclerosis Genetics Consortium; IMSGC/WTCCC2 = The International Multiple Sclerosis Genetics Consortium and the Wellcome Trust Case Control Consortium 2; SNP = single-nucleotide polymorphism; IVW = inverse variance weighted. Cochran’s Q values for all SNPs, proxy SNPs excluded, outlier SNPs excluded, SNPs from IMSGC, and SNPs from IMSGC/WTCCC2 were 40.9 (p = 9.6 × 10⁻⁴), 23.2 (p = 3.2 × 10⁻³), 19.9 (p = 0.17), 19.5 (p = 0.01), and 49.3 (p = 5.5 × 10⁻⁵), respectively. The intercepts in the MR-Egger regression are 0.0070 (SE = 0.0097, p = 0.48), 0.0052 (SE = 0.0212, p = 0.81), −0.0017 (SE = 0.0077, p = 0.83), 0.0095 (SE = 0.0138, p = 0.51), −0.0006 (SE = 0.0113, p = 0.96).

