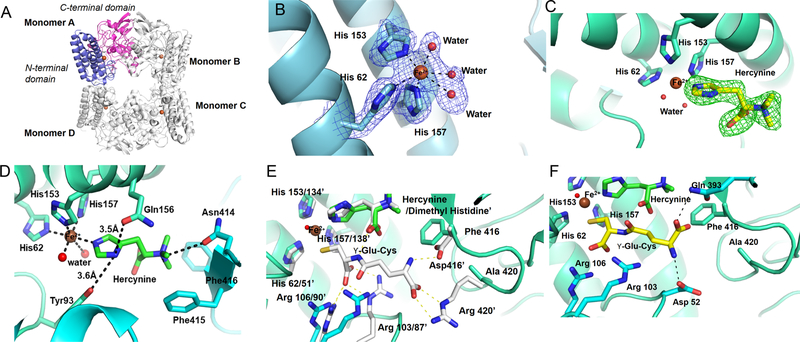
Figure 2.
Structures of EgtBCth and EgtBCth·hercynine binary complex. (A) Overall structure of EgtBCth in the tetrameric configuration with each monomer labeled. In Monomer A, the N-terminal domain (residue 17 to 183) is shown in blue and the C-terminal domain (residue 194 to 433) is shown in pink. The iron cofactor present at the active site of each monomer is shown as a brown sphere. (B) The 2mFo-DFc map of iron coordination site of EgtBCth contoured at 1.5σ (blue mesh); the metal ion is shown as a brown sphere and the coordinating residues are represented in sticks. Ordered water molecules coordinating the iron are shown as red spheres. (C) The mFo-DFc omit map of the active site of EgtBCth cocrystallized with hercynine contoured at 3σ (green mesh). The chemical structure of the substrate hercynine (shown as yellow sticks) was modeled into the positive density. (D) The interaction network between hercynine and EgtBCth active-site residues. Residues interacting with the substrate hercynine are shown in sticks with the potential interactions shown in black dash lines. (E) The previously reported structure of EgtBMth· dimethyl histidine·γ-Glu-Cys complex (PDB ID 4X8D) superimposed on the EgtBCth·herycine complex (shown in green). The side chains of the EgtBMth residues interacting with the γ-Glu-Cys are shown in sticks (white) and numbered with a superscript (′), the corresponding residues in the EgtBCth structure are shown as blue sticks. (F) The putative γ-Glu-Cys binding mode to EgtBCth (shown as yellow sticks). The potential interactions between γ-Glu-Cys and EgtBCth active-site residues were depicted as black dashed lines, and the side chains of the interacting residues are shown as blue sticks

