FIGURE 7.
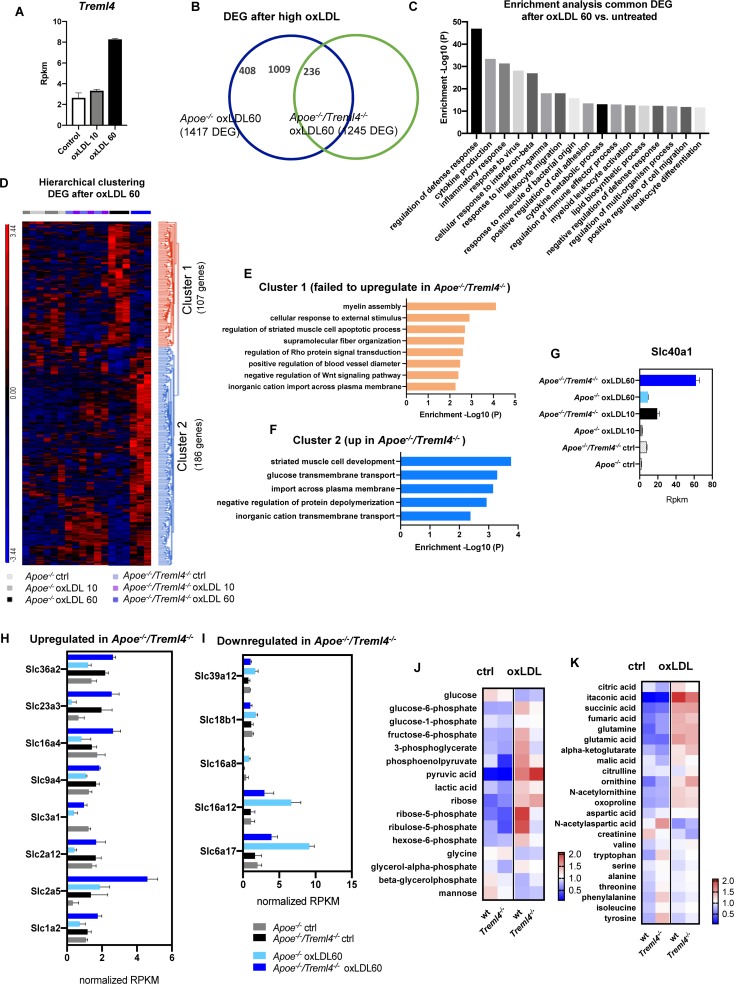
Transcription profiling of oxidized LDL-treated macrophages reveals additional pathways controlled by Treml4. (A) Treml4 RPKM counts in Apoe–/– BMDM after treatment with either low 10 μg/ml (oxLDL10) or high 60 μg/ml (oxLDL60) concentrations for 24 h. (B) Venn diagram of differentially expressed genes (DEG) in Apoe–/– and Apoe–/–/Treml4–/– oxLDL 60 BMDM when compared to their respective untreated control. (C) Enrichment analysis of common DEG (1009 genes) between Apoe–/– and Apoe–/–/Treml4–/– after oxLDL 60 treatment. Top 17 pathways are represented in order of enrichment p-value. (D) Hierarchical clustering analysis of DEG in oxLDL 60-treated Apoe–/–/Treml4–/– BMDM compared to oxLDL 60-treated Apoe–/– BMDM. (E) Enrichment analysis of cluster 1 and (F) cluster 2 from the hierarchical clustering analysis. (G) Slc40a1 rpkm counts in all conditions tested. (H,I) Overrepresented Slc genes rpkm counts from cluster 1 and 2. Rpkm counts were normalized by the mean across all samples for the individual feature. (J,K) Intracellular metabolomics analysis of BMDM treated with 30 μg/ml oxLDL for 24 h. Heatmap represents normalized peak heights per feature.

