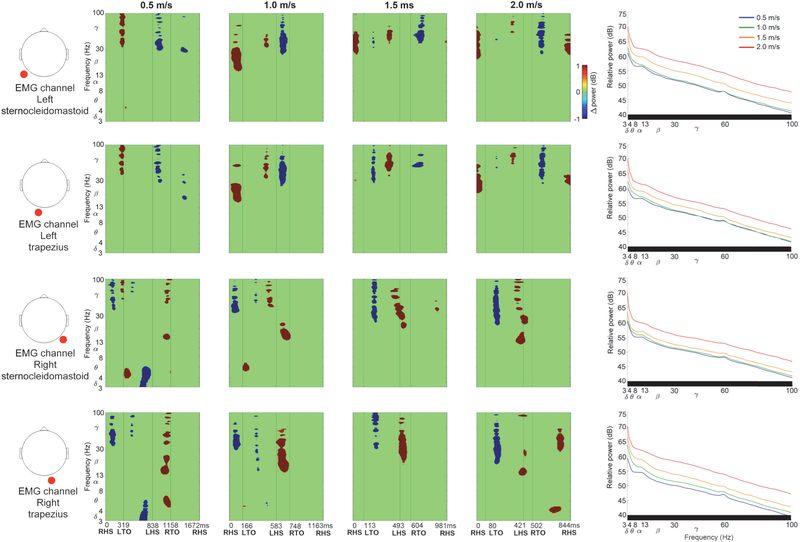
Figure 6.
Exemplar neck EMG channel data (left and right sternocleidomastoid and trapezius muscles). Left to Right: EMG channel location (red circle), Event Related Spectral Perturbation plots at each walking speed (Left to right: slow to fast, significance masked: p < 0.05), Power spectral density at each walking speed (significant speed differences at each frequency identified below each plot in black, p < 0.05). ERSP plots without statistical significance masking are in Supplementary Fig. D.

